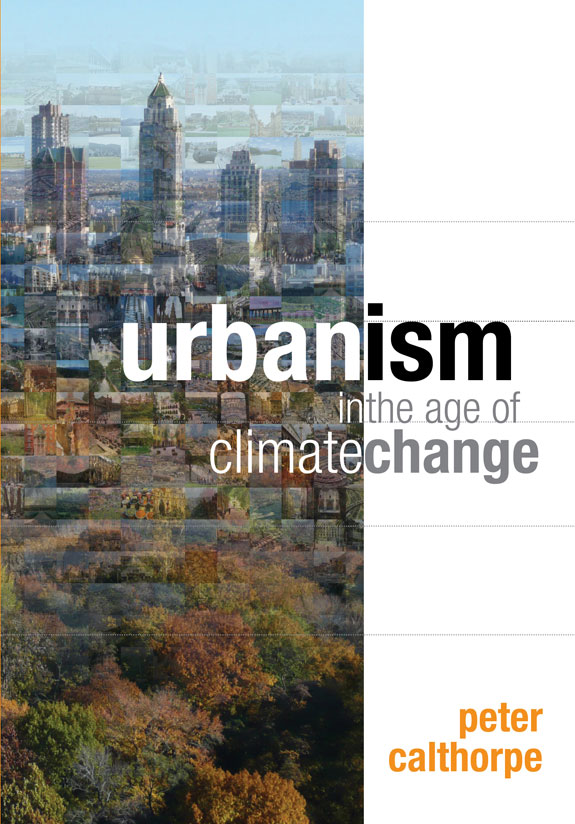
Editor’s note: This concludes our 5-part series of excerpts from Peter Calthorpe’s book, “Urbanism in the Age of Climate Change.” Thanks to Island Press, a few lucky Streetsblog readers will be selected to receive a free copy of the book. To enter the contest, fill out this form. We'll choose the winners tomorrow.
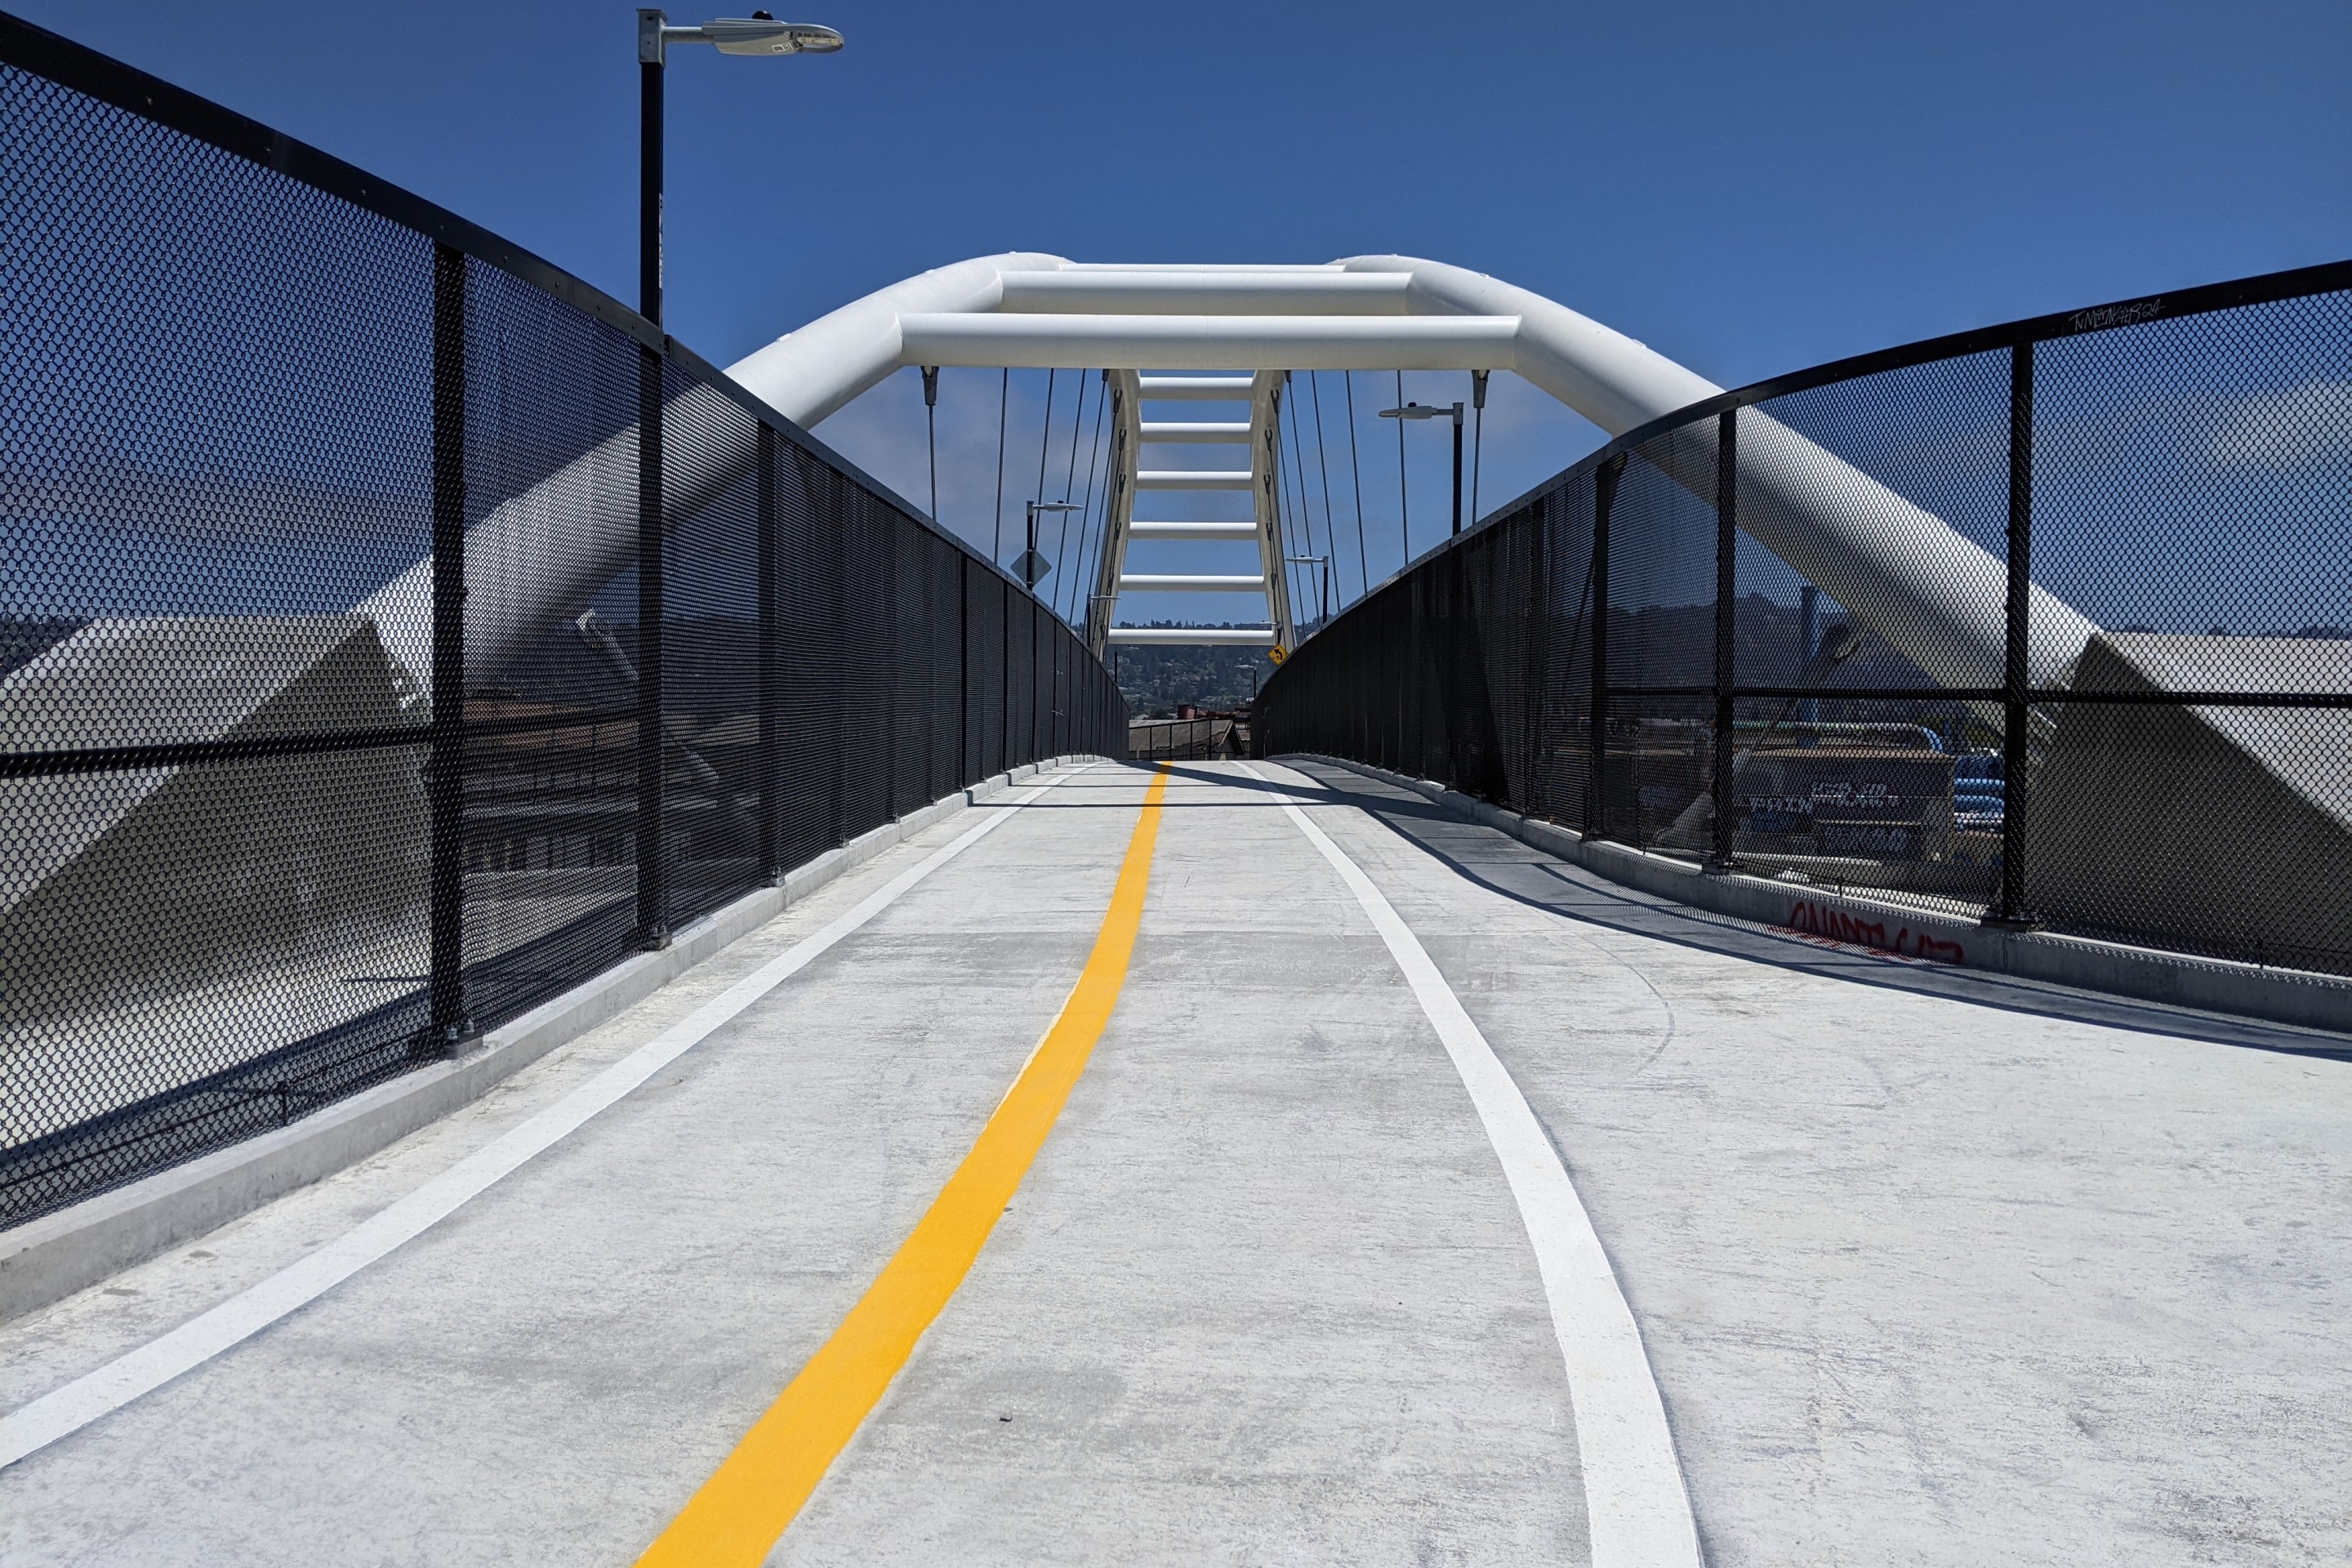
The most important community-scale system dependent on urbanism is transit. It has long been known that density and transit ridership are linked, but it goes much deeper than that. The key to viable transit systems is not just density but walkability and mixed use—true urban places. If people cannot walk the quarter mile to or from a station, chances are they will not use the transit. Conversely, if they can easily run errands and coordinate trips on the way to or from a station, they are more likely to use transit. European data show that the percentage of walk or bike trips always exceeds that of transit trips—often by more than two to one.27 In fact, walking by itself constitutes 30 percent of all trips in Great Britain (versus 9 percent transit), and in Sweden walk/bike trips are 34 percent of the total (versus 11 percent transit). 28 Transit supports and extends the pedestrian environment; transit is pedestrian dependent, not the other way around. The primary alternative to the car and all of its environmental costs is the pedestrian environment and the walkable urbanism that supports transit.
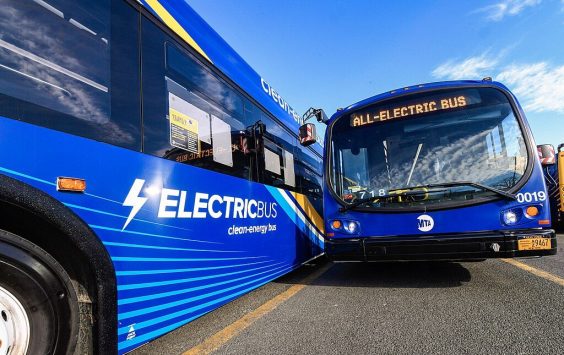
A good transit system has many layers, from local buses to bus rapid transit and streetcars, from light rail to subways and commuter trains. They all feed into and reinforce one another, and they all depend on walkable urbanism at the origin and destination. The quality of the interface from walking to transit, and from one form of transit to the other, is central to displacing car trips and is the greenest technology that urbanism provides.
The relationship among transit, urbanism, travel behavior, and carbon emissions is complex but can be summarized with one key quantifiable metric, vehicle miles traveled (VMT)—effectively, the amount we drive. VMT is determined by the number and distance of trips we take, and our “mode split”—the percentage of trips taken by various transportation modes such as walk, bike, car, carpool, or transit. Each household, depending on its location, income, and size, has an average VMT per year, which when combined with various auto technologies will generate its travel carbon footprint.
Many factors affect VMT, and there are many complex models that simulate the travel behavior behind it. For example, the modal split among auto, walk/bike, and transit is affected by location and level of transit service as well as how pedestrian friendly the streets are; the average length of each type of trip is affected by land use patterns and how closely destinations are located; the number of trips per day is affected by household size; and auto ownership rate is affected by household income and size. The most significant variables in all this are the walking and transit opportunities of urbanism, a compact development form, and land use patterns that bring destinations closer together.
The power of place over travel behavior is demonstrated by mapping VMT per household across a region. While averages always lead us to stereotypes, different environments across any region reveal dramatically different travel behaviors. For example, in the San Francisco Bay Area, a typical household in the Russian Hill neighborhood of San Francisco has an average VMT of 7,300 miles a year. This neighborhood averages only three stories but is dense by suburban standards; has a rich mix of shops, restaurants, and services within walking distance; and is a short transit ride from downtown. Its walk score (an algorithm that awards points based on the distance to the closest amenity in several categories) is 98 out of 100—as good as it gets.
The Rockridge neighborhood in Oakland was created as a streetcar suburb back in the prewar days of the Key Route Trolley system, which connected most of the Bay Area until 1948. It is filled largely with bungalow and small-lot single-family homes but has small apartment buildings at corners and a wonderful mixed-use main street along with a BART (Bay Area Rapid Transit) train station at its center. The average household there drives about 12,200 miles a year and has a walk score of 74. Out in San Ramon, a low-density East Bay suburb without good transit connections, development patterns fit the standard sprawl paradigm, with isolated single family subdivisions, strip commercial arterials, malls, and office parks. VMT for the average home there is around 30,000 miles a year, and the walk score is 46.29
So there is a four-to-one range in travel behavior over three neighborhoods in one region. They differ in density, mix of uses, walkability, proximity to job centers, and level of transit service. The density in Russian Hill is 62 units per acre, but home values are $555 per square foot. In Rockridge, the density averages 15 units per acre and values are $420 per square foot. Finally, in San Ramon, considered a very high end suburban community, the average density is 3.4 units per acre and the value averages just $320 per square foot.30 The market itself is telling us that walkable places have value and, as a bonus, can reduce our carbon emissions and oil dependence. So desirable is the walkable neighborhood that a 2009 study found that in cities like San Francisco and Chicago, moving from a household with a city’s median walkability to one at the 75th percentile would increase the unit’s value by over $30,000.31 The challenge, of course, is to create walkable places as authentic and beautiful as Russian Hill and Rockridge that are affordable.
The point is that all of these community-scale systems—whether power, water, waste, or transit—need urbanism to be effective. Urbanism is essential for the viability of community cogeneration systems and the savings they provide in energy consumption. Denser, mixed-use development can provide the open space, community parks, and riparian setbacks needed by ecological water and waste recycling systems. And, of course, transit depends on urbanism for its fundamental viability.
These community-scale systems built around urbanism are not intended to replace the emissions reductions of efficient industrial processes, renewables in our utility portfolios, or better fuel standards for our cars. It is just that those supply-side strategies alone will not take us far enough quickly enough—and they come at a large cost premium. The combination of transit-served urbanism and green technology at the community scale is essential to complete the picture.
All of this discussion boils down to some simple choices in community building. One alternative simply extends our current land use patterns, architectural types, everyday aesthetics, and civic habits. As one example of this, imagine a room with a low-hung ceiling, sealed windows, and fluorescent lights; within a building with a mirror glass skin, set behind a parking lot off a six-lane arterial; in a zone of commercial development making up part of a suburb of subdivisions, shopping centers, and office parks connected by a freeway to a metropolis of decaying inner-city neighborhoods, struggling first-ring suburbs, exclusive suburban enclaves, failing school systems, and underfunded civic programs. This would seem like a biased contrivance if it were not so commonplace.
The other choice involves a quality of place making we seem to have lost touch with. It could be described as a room with high ceilings filled with natural light and breezes; in a building wrapping a courtyard and lining a street; in a neighborhood with tree-lined avenues, village greens, and local shops; making up a part of a city filled with streetcars, public squares, parks, and cultural districts; providing the focus of a metropolis with a constellation of many varied towns and cities connected by transit, growing economic networks, cultural institutions, and social opportunity. This also may seem like a biased contrivance, but it has been realized in some significant U.S. metro areas.
In both models, each layer is interdependent and connected by deep-rooted economic, policy, and social systems. Each is a complex that cannot easily exist piece by piece but nests layer by layer into a self-reinforcing “whole system.” Certainly, the future will be a mix of these two extremes, but the question is: in what proportions?
Just how much change in land use, technology, and place making we can tolerate is the topic of the next chapter. A look back over the past fifty years of development and urban form reveals just how dramatic the shifts can be—and what trends will direct future growth. The question then becomes how to shape a vision for our future and what will be the best balance of design standards, policies, technologies,
and economies to bring it about.
From Urbanism in the Age of Climate Change, Chapter 1, by Peter Calthorpe. Copyright @ 2011 Peter Calthorpe. Reproduced by permission of Island Press, Washington, D.C.
Notes:
27. Organisation for Economic Co-operation and Development (OECD), “Safety of Vulnerable Road Users” (Paris: OECD, 1998), 47.
28. OECD, “Safety of Vulnerable Road Users.”
29. John Holtzclaw, Mary Jean Burer, and David B. Goldstein, “Location Efficiency as the Missing Piece of the Energy Puzzle: How Smart Growth Can Unlock Trillion Dollar Consumer Cost Savings” (Asilomar, CA: Natural Resources Defense Council and the Sierra Club, 2004); Front Seat, “Walk
Score: Helping Homebuyers, Renters, and Real Estate Agents Find Houses and Apartments in Great Neighborhoods,” http://www.walkscore.com/ (accessed February 10, 2010).
30. Prices per square foot are calculated using the online real estate services of Trulia.com using quarterly real estate statistics from 2009. Densities are calculated as a net of residential parcels using data from city and neighborhood boundaries established by the corresponding municipality.
31. Joe Cortright, “Walking the Walk: How Walkability Raises Home Values in U.S. Cities” (Chicago, IL: CEOs for Cities: 2009), table 8