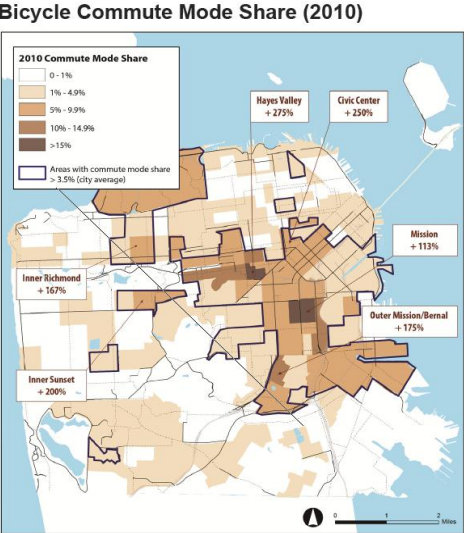
As the SFMTA figures out how to increase bicycling to 20 percent of all trips citywide, some neighborhoods are already approaching that milestone. A map that the SFMTA compiled from bike-to-work data in the 2010 U.S. Census shows that as of two years ago, some neighborhoods far exceeded the citywide rate of 3.5 percent.
In the Mission and Hayes Valley, more than 15 percent of work trips are made by bike, according to the map. A number of other neighborhoods, like NoPa, western SoMa, and the Inner Richmond have bike commute rates of at least 5 percent and saw jumps as high as 275 percent over the 10-year period.
"This map confirms what we are seeing every day: more people are biking than ever before, especially in those neighborhoods that have made it more comfortable to bike," said Leah Shahum, executive director of the SF Bicycle Coalition. "This is strong evidence that if the city continues to increase its investment in better biking by connecting neighborhoods with safe, inviting bikeways, San Francisco can reach the goal of 20 percent of trips by bike by 2020."
Why is bike commuting so popular in these neighborhoods? Some common characteristics jump out, like proximity to downtown and access to flatter routes with bike lanes. For instance, Valencia Street connects the areas around the Mission, and the Wiggle and the Panhandle connect NoPa, the Haight, and the Inner Sunset.
SF State University Geography Professor Jason Henderson thinks overcrowded Muni lines could also drive more residents to try bike commuting. "These are areas where Muni is filled to capacity," he said. "For example, in Hayes Valley, by the time buses coming from west towards downtown pass through, they are overcrowded. Haight 6 and 71 are always full once crossing Fillmore eastbound."
"So my hunch is that in part," he said, "people in the inner ring neighborhoods are fed up with Muni overcrowding and taking up cycling."
He also suggested other factors that may be at work, like "environmental awareness, health incorporated into routines, and that the actual promotion of bicycling by the SFBC and the SFMTA having an impact, along with the actual bike lanes that did not exist five years ago."
"Overall, [the data] tells me that we need to provide much more bike space to get to [20 percent of trips by bike], and if we do, we will get there," he said.
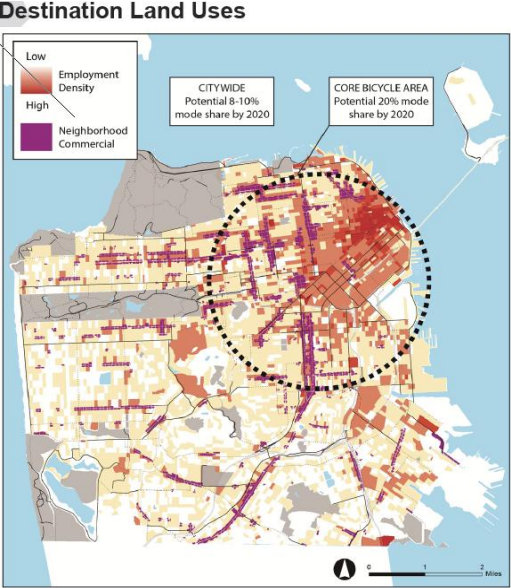
The map was included as part of an SFMTA presentation [PDF] to the SF Capital Planning Committee this week outlining the framework of the upcoming Bicycle Strategy, which SFMTA staff expects to present to its board on January 29. Even if San Francisco isn't able to reach its official goal of 20 percent of trips by bike by 2020, SFMTA Deputy Director of Planning Tim Papandreou said the agency is optimistic that it can reach that goal within the city's inner, denser neighborhoods that are already seeing high rates of cycling. Although data hasn't been collected for bicycling mode-share for all trips, he speculated that the rates for non-commute trips would likely be higher than the rate for commutes alone.
Henderson noted that protected bikeways on Market Street in the Better Market Street plan will be crucial in meeting the SFMTA's bicycling goals. "One critical thing is looking at the map, the center of the 'bike core' is Market Street between Church and Van Ness," he said. "As Better Market Street goes into design, we need to take away car lanes on the stretch between Church and Van Ness, where the city is accommodating too many cars at the expense of safe cycling. There are sets of two-lane turn lanes feeding cars to Franklin, for example. It is the opposite of sustainable transport what the city is allowing on that part of Market. They need a transit-only lane, and two wide cycle tracks. The cars come last."
