SPUR Talk: Designing Cities to Reduce Emissions
Building dense housing around transit stations, encouraging lower emission and electric cars, designing cities to encourage walking and biking–those are all great policies. But how does one measure whether the policies are actually lowering CO2 emissions from automobiles? That was the subject of a forum today at SPUR’s San Francisco location.
Under the Sustainable Communities and Climate Protection Act of 2008, better known as S.B. 375, the state’s Metropolitan Planning Organizations (MPOs), which, for the Bay Area, is the Metropolitan Planning Commission (MTC), must adopt land use and transportation policies that will reduce vehicle miles traveled (VMT)–and with it, air pollution from cars. They have specific, per-capita targets to reach. The target for the MTC was “…15 percent, and our proposed targets would bring it up to 19 percent for 2035,” said Carey Knecht, a pollution specialist at the California Air Resource Board (CARB), which regulates emissions.

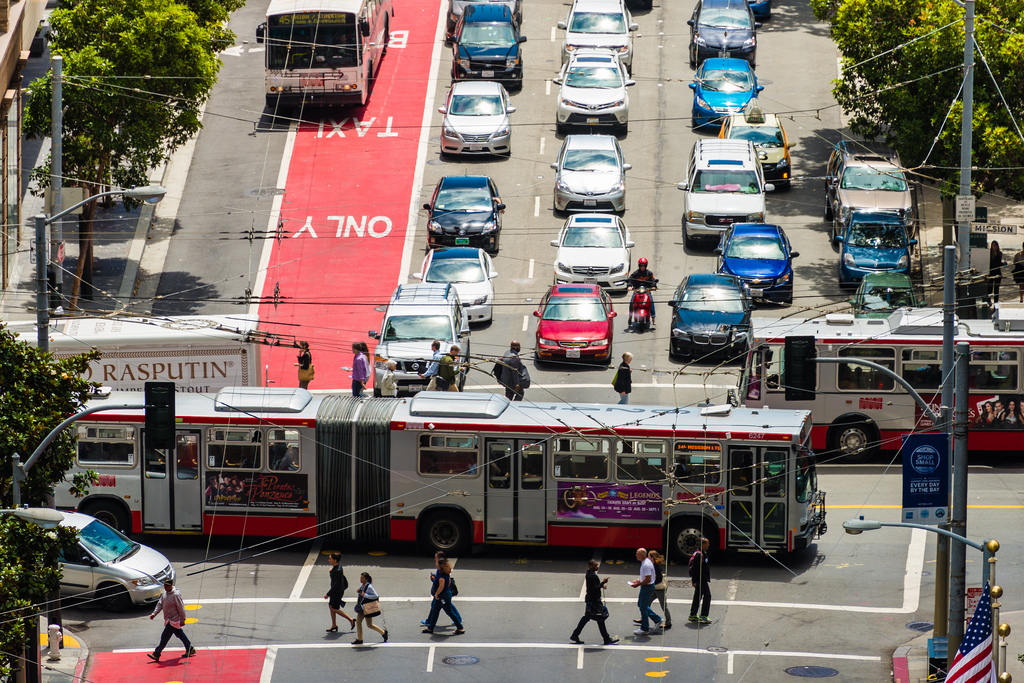
But how does one attach and quantify pollution reductions that come from, for example, converting traffic lanes into bus-only lanes, such as with the red-painted lane in the lead image? How does one measure the effect on emissions and figure out if the region is reaching its state-mandated goals? That takes complex modeling.
And that’s the job of Lisa Zorn with the MTC.
Zorn, whose background is in computer programming, said they looked at land use and transportation in 2005 and, through surveys and other research, figured out how far people had to travel, on average, to get to businesses, shopping, home, etc. Then they compare land use patterns now and redo the survey and calculations. All of that gets plugged into a sophisticated computer model. But there are many other factors; Zorn said they also look at things such as “… commuter benefits, employer shuttles, regional electric charging stations, and a bunch of other strategies that aim to reduce greenhouse gas emissions” and relate those to how they reduce driving. Compare the differences in the surveys and do the math, and planners and regulators can start to build a picture of how much VMT is changing.
Of course, there are big limitations as to what policies a regional entity can put in place–and that also impacts measurements. When the S.B. 375 targets were first envisioned, gas prices were high and the models expected them to continue going up. But that didn’t happen, explained Zorn. In other words, the land use policies could be in place, but cheap gas might negate any effect on emissions.
“That’s something that could make a big difference,” said Zorn, adding that the price of gasoline (and the price of driving overall) is perhaps the biggest single factor and one of the best tools for reducing emissions. “But we don’t have authority to do that.” Raising gas taxes and vehicle licensing fees can only be done by the state.
Of course, the passage of S.B. 1, the recent gas tax, could mean that in theory, VMT should start coming down. So modeling for enforcing S.B. 375 targets has to take that into consideration. Consideration, yes . . . “but we can’t take credit for that [to qualify as having fulfilled the requirements of S.B. 375],” said Zorn. “We have to use a model for land use and travel that analyzes how well our plans and transportation projects embedded in the plan do in achieving the targets.”
And if that all seems hard enough to figure out, bring Uber and Lyft into the mix. “We’ve really seen a shift [in VMT],” said Zorn.
But, so far, they don’t have any data from ride-hail companies to incorporate into the regional models. They can’t determine if these services increase, reduce, or have a nominal effect on greenhouse gas emissions. “To incorporate things into the model you need data, and our last household travel survey was before Transportation Network Companies (Uber and Lyft, etc).” In other words, the models could show VMT appearing to be going down since 2005, even though Uber and Lyft might actually be causing the real-world numbers to go up.
All of which calls into question whether anyone can be sure what’s really going on with CO2 emissions from transportation. According to the panelists, they don’t have a way to measure CO2 emissions directly by region (at least in any way that they could hope to relate to land use and transportation policy, since there are so many other CO2 emitters). The hope is that eventually Uber and Lyft will be forced to share travel data with environmental regulators.
And then there’s the question of autonomous cars: what will they do to the CO2 picture? Zorn said she hopes they’ll all be electric but, so far, that doesn’t seem to be where these companies are heading.
“I’m concerned we’re finally going to collect all the data [in 2035] and find that our greenhouse gas emissions are way higher than they were before,” said Zorn.

For more events like these, visit SPUR’s events page.

Streetsblog has migrated to a new comment system. New commenters can register directly in the comments section of any article. Returning commenters: your previous comments and display name have been preserved, but you'll need to reclaim your account by clicking "Forgot your password?" on the sign-in form, entering your email, and following the verification link to set a new password — this is required because passwords could not be carried over during the migration. For questions, contact tips@streetsblog.org.