Biking in SF Nearly Doubled Since 2006; Funding Push Gains Traction
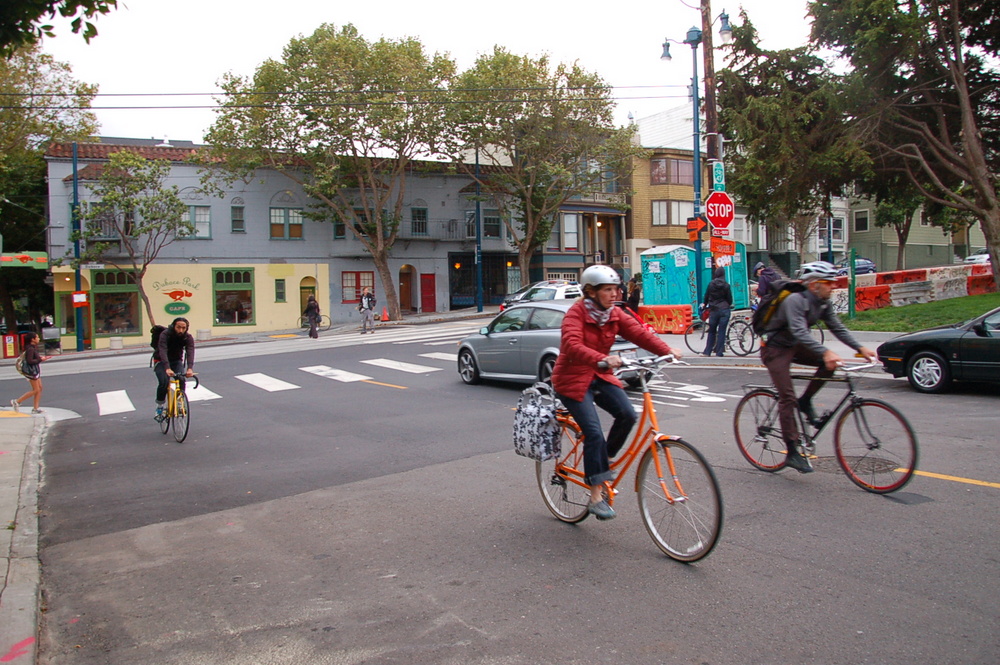
Despite the slow roll-out of safer streets for bicycling compared to cities like New York and Chicago, San Franciscans are making nearly twice as many trips by bike today as they did in 2006, according to a new count released by the SFMTA. Still, city leaders must significantly increase the paltry amount of transportation funds devoted to bicycle infrastructure in order to reach the SFMTA Bicycle Strategy's goal of 20 percent of trips by bike by 2020, according to the City Budget Analyst.
"We've been getting lucky for a long time," said Amandeep Jawa, president of the League of Conservation Voters, at a Board of Supervisors hearing last week. "We've been spending less than 1 percent of our transportation budget on bicycling, but we're already at 4 percent of trips. The opportunity before us is about funding the [bike] network... the more connected a network is, the better it does. If we really get serious about funding the full build-out, the improvements will be much more dramatic."
As we've reported, bicycling has skyrocketed in the most bike-friendly neighborhoods like the Mission and Hayes Valley, where over 15 percent of commuters already get to work by bike, according to the 2010 census. As of 2012, bicycling comprised 3.8 percent of commute trips citywide, according to the SFMTA. Commute trips are only a fraction of overall trips and may not represent overall bike mode share.
Between 2011 and 2013, bicycling increased an average of 14 percent at 40 observed intersections, according to the SFMTA's new report. At 21 intersections where the agency started counting bikes in 2006, the number has increased 96 percent within the full seven-year period.
Within the last two years, the corridors which saw the highest jumps in bike traffic, each around 35 percent, were Townsend, Second, and Polk Streets, according to the report. At specific points where recent bike improvements were made, the increases were even more dramatic:
- At Fell and Scott Streets, where protected bike lanes were installed on three blocks Fell and Oak Streets, bike traffic has increased 52 percent.
- At Page and Stanyan Streets, where bicycle traffic signals and a bike ramp were installed at the entrance to Golden Gate Park, bicycling increased 78 percent.
In addition, Lower Market Street, which has seen bike lanes improved with posts, green paint, new pavement, and a digital-display bicycle counter near Eighth Street, gets up to 3,000 bikes per day on average (no previous count at that spot is available).
"It’s clear that if we build it, they will come," said Leah Shahum, executive director of the SF Bicycle Coalition, in a statement. "No other mode of transportation is growing as fast or has a higher return on investment in terms of improving our city for everyone. It’s time for the city to truly invest in our bicycle network, and ensure that our city’s streets are welcoming and comfortable for the growing number of people riding."
Although Mayor Ed Lee has previously indicated that funding the SFMTA's Bicycle Strategy is not a priority for him, he issued a statement on the new bike counts:
Every year we are seeing more people riding a bicycle in San Francisco, and the latest bicycle count data proves it. With an increasing amount of people riding bicycles, we must continue to ensure improvements are made to increase the safety, connectivity and convenience of our city’s bike network. With bicycling becoming more commonplace in San Francisco, we must meet and support the rising demand for better bikeways.
But as highlighted at last week's hearing called by Supervisor Eric Mar, the SFMTA has nowhere close to the amount of funding or staff it needs to roll out the protected bike lanes and traffic-calmed routes envisioned in its Bicycle Strategy. While the "System Build Out" scenario backed by the SFMTA Board would bring bicycling up to 20 percent of all trips and require an estimated $580 million, the agency is struggling to finance its more modest "Strategic Plan" scenario, which could bring bicycling up to 8 to 10 percent of trips by 2018 at a cost of $191 million.
Currently, SF spends $9.16 per capita on bicycling, compared to Amsterdam (where a majority of trips are made by bike), which spends $22.44, and Minneapolis, Minnesota, which spends $12.72 -- the highest in the U.S., according to the City Budget Analyst. Seattle and Portland spend around $10 per capita on bicycling.
The most concrete proposals to increase local bicycle funding in SF come from the Mayor's Transportation 2030 Task Force. Several of its proposed measures to boost funds for transportation could head to the ballot next November, but at the most, they would still only provide about half of what's needed for the SFMTA's "Strategic Plan" scenario.
With a record number of San Franciscans killed while biking in the past year, Mar said he was "pissed off" that SF isn't doing more to make its streets safer. And a November poll showed that a majority of San Franciscans think that improving conditions for bicycling to make it a more inviting mode of transport should be a high priority.
"Bicycling needs to feel safer for our families," said Mar. "The responsibility to fund our bicycle infrastructure really falls on all of us as the Board of Supervisors, but also the mayor and our city departments as well, and I believe we have failed in that."
Read more from the hearing from the Bay Guardian and the SF Examiner. The 2013 Bicycle Count Report can be found on the SFMTA website.
Stay in touch
Sign up for our free newsletter
More from Streetsblog San Francisco
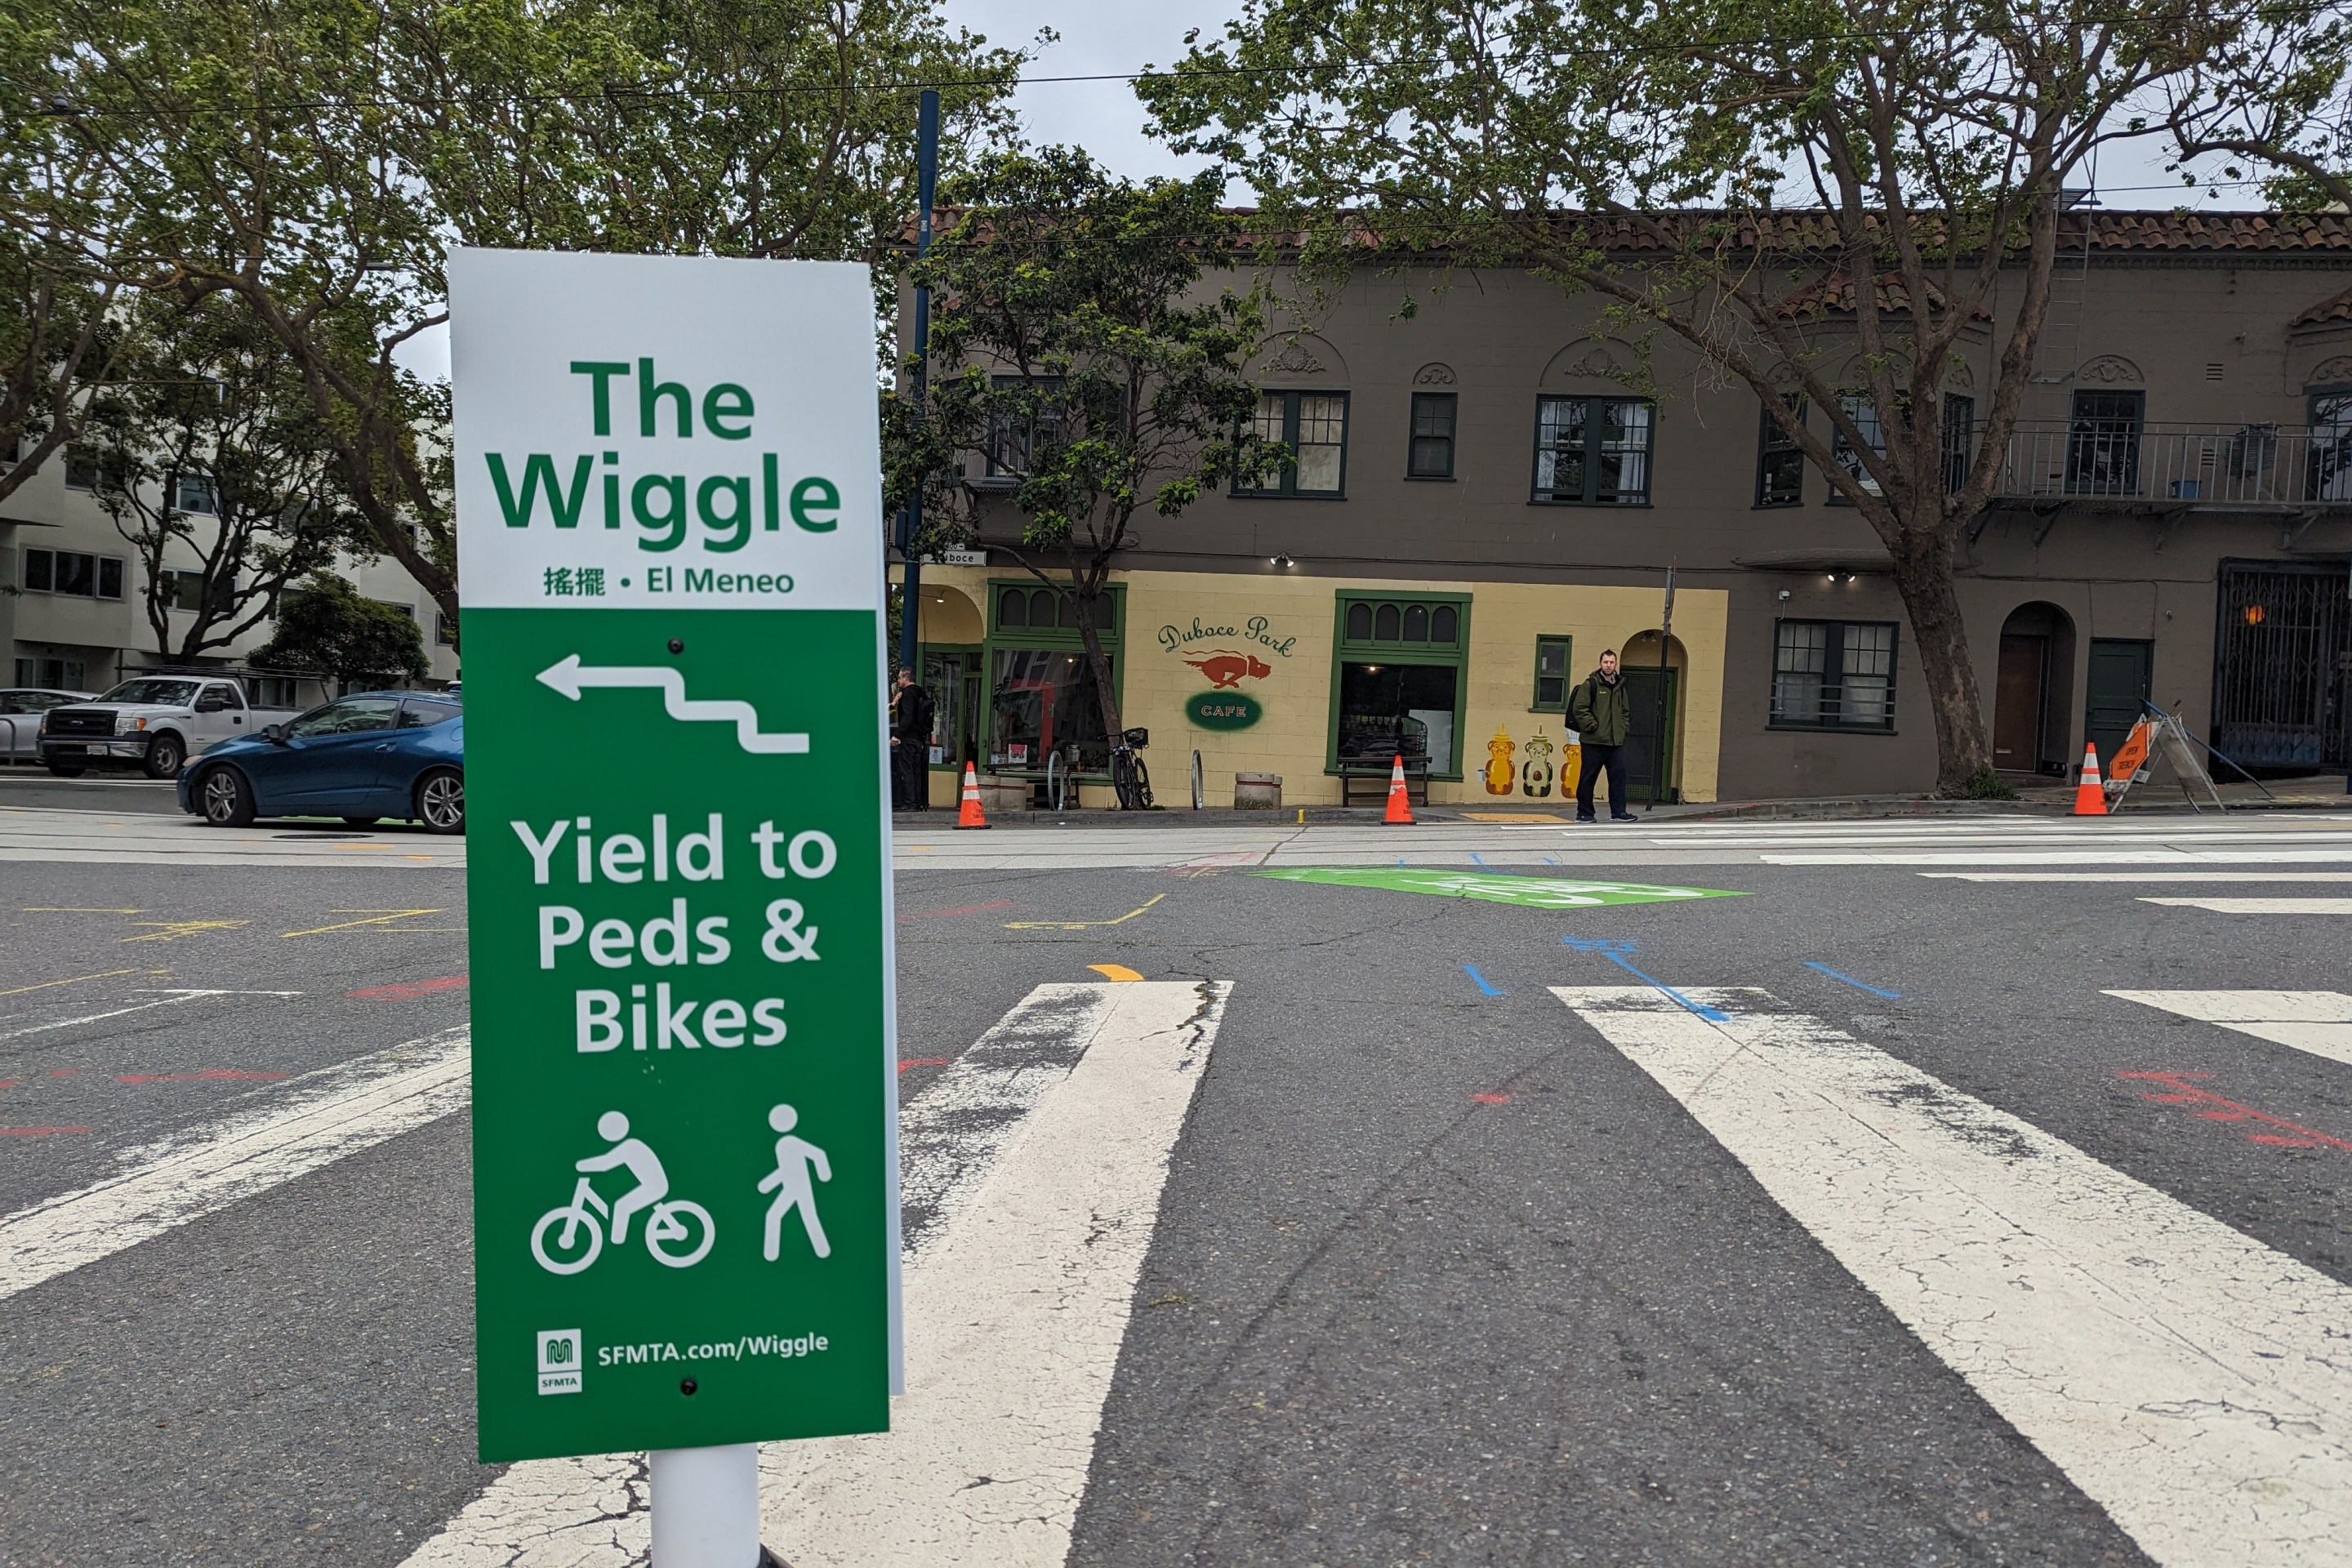
Independent Safety Advocates Beef up the Wiggle
Signs and soft-hit posts installed by advocates make the Wiggle bike route calmer and safer for cyclists and pedestrians