Editor's note: This week and next, we're presenting a 5-part series of excerpts from Peter Calthorpe's book, "Urbanism in the Age of Climate Change." This is installment number two. Thanks to Island Press, a few lucky Streetsblog readers will be selected to receive a free copy of the book. To enter the contest, fill out this form.
California’s effort to implement its new greenhouse gas reduction laws has provided a comprehensive look at urbanism and its potential in relation to a range of conservation and clean energy policies. The Vision California study, developed for the California High Speed Rail Authority and the California Strategic Growth Council, measured the results of several statewide land use futures coupled with conservation policies through the year 2050.5 The results make concrete the choices before us, the feedback loops, and the scale of both benefits and costs.
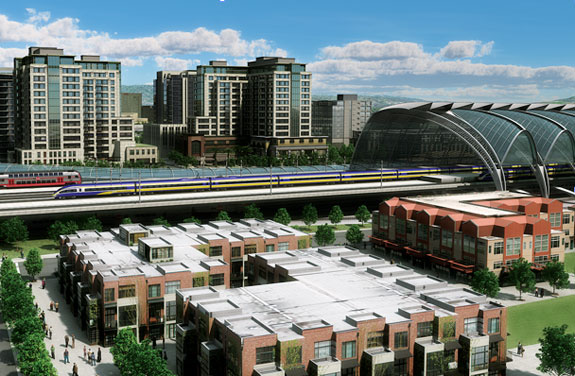
California is projected to grow by 7 million new households and 20 million people, to a population of nearly 60 million, by 2050.6 It is currently the eighth-largest economy in the world and therefore provides an important model of what is possible. The study compared a “Trend” future dominated by the state’s now typical low-density suburban growth and conservative conservation policies to a “Green Urban” alternative. This Green Urban alternative assumed that 35 percent of growth would be urban infill; 55 percent would be formed from a more compact, mixed-use, and walkable form of suburban expansion; and only 10 percent would be standard low-density development. In addition, the Green Urban alternative would push the auto fleet to an average 55 miles per gallon (MPG), its fuel would contain one third less carbon, and all new buildings would be 80 percent more efficient than today’s norm. It does not represent a green utopia, but it is heading in that direction. The results of this comparison highlight just how much is at stake and what the costs will be.
Remarkably, the quantity of land needed to accommodate the next two generations was reduced 67 percent by the Green Urban scenario, from more than 5,600 square miles in the Trend future to only 1,850 square miles. By comparison, the state’s current developed area is 5,300 square miles.7 This difference would save vast areas (up to 900 square miles) of farmland in the Central Valley along with key open space and habitat in the coastal regions of the state. The more compact future means smaller yards to irrigate and fewer parking lots to landscape, saving an average of 3.4 million acre-feet of water per year—enough to fill the San Francisco Bay annually or to irrigate 5 million acres of farmland.8 Less developed land also translates to fewer miles of infrastructure to build and maintain. The annual savings would be around $194 billion for the state, or $24,300 for each new household—not including the costs of ongoing maintenance. In addition, the Trend future would cost more in police and fire services as coverage areas increase.

Surprisingly, such a future would not dramatically change the range of housing choices available in the state. In fact, some would argue that the outcome would be more market responsive, providing a long overdue adjustment of housing types and prices. Specifically, while large single-family lots would decline from 40 percent of the total today to 30 percent in 2050, small-lot homes and bungalows would increase slightly and townhomes would double to 15 percent. Multifamily flats, condos, and apartments would actually end up the same, at around a third of the market. Overall, detached single-family homes would drop from 62 percent of all homes today to just over half. Many would conclude that this would be a reasonable shift, one ultimately making the housing stock more diverse and affordable—not, as some would argue, the end of the American dream.
In the Green Urban future, auto dependence drops dramatically—in fact, average vehicle miles traveled throughout the state would be reduced 34 percent, to 18,000 miles per household, from a Trend projection of 27,200. Closer destinations, better transit service, and more walkable neighborhoods all contribute to this significant shift. We would all still have cars, but they would be more efficient and we would use them less. The implication of this reduction in auto use is far-reaching. In terms of congestion, it is the equivalent of taking over 15 million cars off the road.9 There would be fewer roads and parking lots built, less land covered with impervious surface, and less runoff water to be cleaned and stored. The list of collateral benefits is long. In fact, the need for new freeways, highways, and arterials is reduced by 23,000 lane-miles, a saving of around $450 billion for the state.
Less driving means fewer accidents, in this scenario potentially saving around 3,100 lives and $5 billion in associated costs per year.10 Less driving means less air pollution and less respiratory disease.11 More walking means healthier bodies and less obesity, affecting diabetes rates and all of its associated health costs.12
Most significantly, the Green Urban scenario reduces carbon emissions and comes very close to achieving the 12% Solution in the transportation sector of the economy. When the savings in vehicle miles traveled are combined with low-carbon/high-MPG cars, emissions for transportation drop from more than 260 million metric tons (MMT) to just 29. Moreover, we would consume 352 billion fewer gallons of fuel over the next forty years, for a saving of over $2.1 trillion. These numbers are almost too big to imagine, but by way of comparison, the proposed high-speed rail system running from San Diego to San Francisco is projected to cost $42 billion, less than one-fifth the value of the potential annual gas savings. Put simply, at a projected $8 per gallon in 2050, these gas savings represent around $6,100 in savings per household.
There is more. The efficient and compact buildings of urban development use less energy, produce fewer greenhouse gases, and cost less to operate. The carbon reduction in the building sector is projected to be over 62 percent less, not enough to achieve its share of the 12% Solution but a significant and necessary step. In total, the average household in the Green Urban future would save around $1,000 a year in utility payments. When this figure is combined with reduced auto ownership, maintenance, insurance, and gas costs, California households would save close to $11,000 a year in current dollars. With an interest rate of 5 percent in 2050, this could pay a mortgage of $200,000.
What is not to like in such a Green Urban future? For some, exactly the thing that makes most of these savings possible: a more urban life.
From Urbanism in the Age of Climate Change, Chapter 1, by Peter Calthorpe. Copyright @ 2011 Peter Calthorpe. Reproduced by permission of Island Press, Washington, D.C.
Notes:
5. Information about the assumptions, methodology, and results of the Vision California study and modeling tools can be found here.
6. California Department of Finance, “Population Projections by Race,” State of California. (accessed February 12, 2010).
7. Natural Resources Conservation Service, “National Resources Inventory 2003 Annual NRI,” U.S. Department of Agriculture. (accessed February 12, 2010).
8. San Francisco Bay estimate based on William Emerson Ritter and Charles Atwood Kofoid, eds., University of California Publications in Zoology, vol. 14 (Berkeley: University of California Press, 1918), 22; agricultural data from Economic Research Service, “Western Irrigated Agriculture,” U.S. Department of Agriculture. (accessed April 1, 2010).
9. Research and Innovative Technology Administration, “Table 5-3: Highway Vehicle-Miles Traveled (VMT),” Bureau of Transportation Statistics. (accessed February 12, 2010).
10. Bureau of Transportation Statistics, “National Transportation Statistics 2009” (Washington, DC: U.S. Department of Transportation, 2009), table 2-1. The fatality rate per mile traveled is assumed to hold consistent from 2009 until 2050. Hospital costs data from National Highway Traffic Safety
Administration, “The Economic Impact of Motor Vehicle Crashes 2000” (Washington, DC: U.S. Department of Transportation, 2002), 60.
11. U.S. Environmental Protection Agency (EPA), “National Air Quality: Status and Trends through 2007” (Research Triangle Park, NC: EPA, 2008).
12. David R. Bassett Jr. et al., “Walking, Cycling, and Obesity Rates in Europe, North America, and Australia,” Journal of Physical Activity and Health 5 (2008): 795–814.


