This article was originally published by the Fang Law Firm, but it is presented here because it reflects an interesting perspective on the challenge of intersection design.
On Aug. 29, 2021, a pedestrian was killed in a hit-and-run collision at the intersection of Lalor Street and Route 129 in Trenton. Months earlier, another pedestrian was struck and killed by a car while crossing the same intersection. In 2016, one of the crossing guards – assigned at the intersection to improve pedestrian safety during peak crossing times – was struck and killed by a pickup truck.
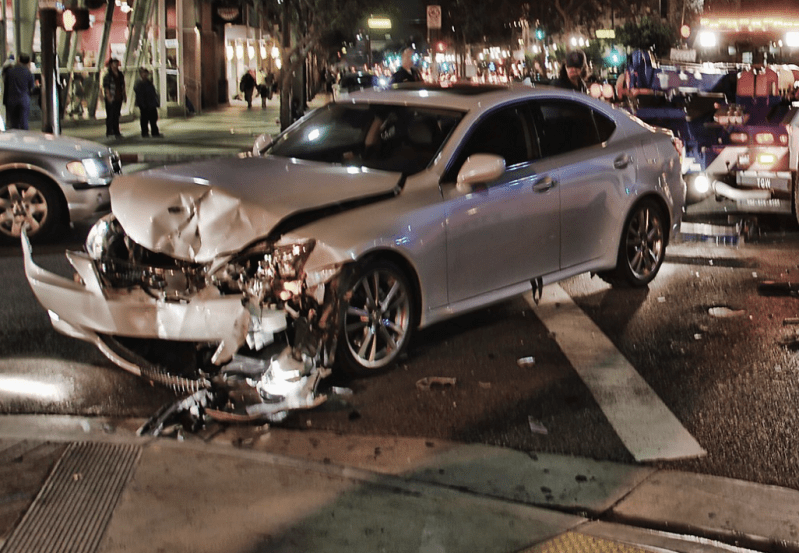
In the United States, nearly 25 percent of all fatal crashes occur at intersections. While a deadly collision can happen anywhere and at any time, are there intersections where motorists may be at a higher risk of being killed than others?
In order to understand the full scope of the issue, we worked with 1Point21 Interactive to examine 20 years of fatal crash data from the NHTSA. From 2000 through 2019, there were 159,394 fatal crashes designated as intersection-related. However, not all intersections are created equal and we found that it was extremely rare for multiple fatal crashes to occur at a single crossing.
Consider this. There are about 15,812,406 intersections in the continental United States. Less than 1 percent saw even one fatal crash (147,000). Only 1,828 had three or more fatal crashes — less than .01 percent.
Anatomy of a deadly intersection
As a result of our analysis, we determined that any intersection where at least three fatal crashes occurred should be considered a deadly intersection. A total of 1,828 intersections in the U.S. fit this criterion. What did these crossings have in common? We observed that deadly intersections are:
- most likely to be at the crossing of a secondary road (a highway) and a local road
- disproportionately located in a rural area
- very rare — only .01 percent of all intersections
Half of all deadly intersections are at the crossing of a secondary road and a local road – despite these only making up 10 percent of all intersections.
A secondary road is a main artery without limited access – typically a U.S. highway, state highway, or county highway. These roads have one or more lanes of traffic in each direction, may or may not be divided, and usually have at-grade intersections with many other roads and driveways. A local road is generally a road with a single lane of traffic in each direction. When high-speed traffic areas meet lower speed traffic areas, there is more likelihood of crashes.
Populated areas are less dangerous
Of America's 1,828 deadly intersections, 36 percent are located in rural areas – despite only 18 percent of the U.S. population living in rural areas. We defined rural areas as any area that is not inside the limits of a city with a population of over 2,500.
There are several possible reasons for higher fatal crashes to occur at rural intersections, in spite of the low population. People in rural areas drive at higher speeds, more often drive without wearing seatbelts or while intoxicated, and if they are injured, they may not receive timely medical care given their remote location. The design and layout of rural roads – older and more outdated than urban roads – may also be a contributing factor.
The deadliest intersections
The deadliest intersection in the U.S. — Lalor Street and Route 129 — is located in Mercer County, N.J. and it saw nine fatal crashes from 2000 through 2019.
This intersection is one of just 15 in the U.S. that had seven or more fatal crashes during that time period. Among these crossings, four are located in New Jersey, four in Florida, and two in Texas.
What is alarming is that two of the deadliest intersections are only four blocks apart: Spring Street (U.S. Routes 1&9) and East Jersey Street and Spring Street (U.S. Routes 1&9) and East Grand Street in Elizabeth, New Jersey. Both intersections are at the crossing of a local road (East Jersey and East Grand Streets) and a highway (US-1&9). There were nine fatal crashes at East Jersey Street and U.S. Routes 1&9. Four blocks away, at U.S. Routes 1&9 and East Grand Street, there were seven fatal crashes, the latest in 2018.
These intersections were identified in the City of Elizabeth’s 2005 Master Plan and were studied by the New Jersey Department of Transportation for safety improvements.
The Bureau of Safety Programs worked on improving pedestrian safety at these intersections through enhancements to signal layouts and operations. The following improvements were made:
- East Jersey Street: Pedestrian signals were added and minor signing and striping enhancements were installed. The minor street approaches received separate left-turn lane use designation and protected/permissive lead phasing.
- East Grand Street: Pedestrian indications were added for all four crossings and near left clamp-mounted vehicular signals were installed.
Despite these improvements, fatal crashes have continued to happen at these intersections. In fact, all of the combined 16 fatal crashes at these two intersections have happened after the 2005 Master Plan identified them as dangerous.
Which cities have the most deadly intersections?
Out of all metropolitan cities, Miami stands out with the most intersections that our study classified as deadly, followed by Phoenix and New York. From 2000-2019, 138 intersections in Miami were the site of three or more crashes. Interestingly, in addition to Miami, three more cities in Florida make up for the deadliest intersections – Tampa, Orlando, and Sarasota.
South Florida has some of the worst intersections in the U.S. – as well as the worst congestion. Florida, a popular tourist attraction, is heavily populated with drivers, pedestrians, motorcyclists, and cyclists at all times, increasing both the risks of a traffic jam and a crash.
The deadliest intersections by state
Methodology
In this study, we analyzed 2000-2019 fatal crash data from the National Highway Traffic Safety Administration to filter crashes that occurred in an intersection, or were caused by traffic moving through an intersection (eg. The crash occurred outside the intersection itself but happened because of someone turning, or something of that nature).
We did not include crashes that happened on freeway interchanges, or happened in other types of intersections, like driveways or walking path/street intersections.
