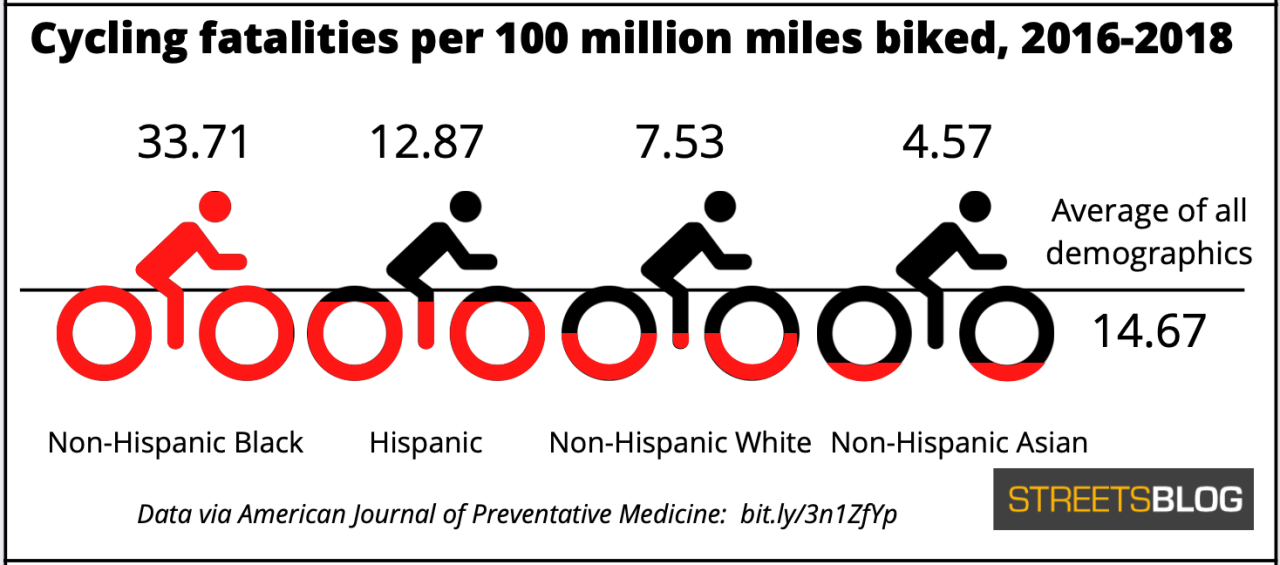
Black cyclists are more than four times more likely to die while riding a bike than White ones on a per mile basis, a new study finds — and the stats aren't much better for other modes or other racially marginalized groups.
Researchers at Boston and Harvard universities found that non-Hispanic Black cyclists suffer about 34 deaths for every 100 million miles they traveled on a bicycle, compared to just 7.5 deaths for non-Hispanic White cyclists covering the same distance. The fatality rate for Black pedestrians, meanwhile, was 2.2 times higher per mile, and even Black vehicle occupants died at nearly twice the rate (1.8) as their White counterparts, underscoring the findings of earlier research into the structural racism of our transportation systems.
Hispanic cyclists and pedestrians also had higher per-mile fatality rates than White ones — 70 percent and 52 percent more, respectively — while Asian bikers and walkers, by contrast, died significantly less often than their White counterparts (64 percent less for people on bikes and 45 percent less for pedestrians).
Indigenous Americans were not part of this study, but earlier research showed residents of native nations are most likely to be killed while walking, when controlled for both how often they travel on foot and their share of the population.

And even as walking deaths per-mile in urban areas were lower overall, Black walkers still died about twice as often as their White neighbors on city streets.
That's despite the fact that Black residents logged proportionally fewer miles on foot, bike, or car than most other groups, relative to their share of the population, according to the National Household Travel Survey data from which the stats were sourced.
Notably, that data spans both transportation and recreational cycling, which could help explain why White cyclists, who are the demographic group most likely to ride exclusively for recreation or sport rather than transportation, logged significantly more miles per capita than cyclists from other demographics. White riders may also be more likely to have access to long, connected networks of low-stress routes, at least in some areas.
Or, as study co-author and Boston University Ph.D. candidate Matthew Raifman succinctly put it, "The ability to safely bike 40 miles on a rail-to-trail line in the suburbs is very different from the ability to ride a few blocks on a sharrow in a city."
Raifman is careful to note that his team's data alone doesn't present a clear picture of why, exactly, some racially marginalized groups are more likely to die on active modes. Earlier research, though, shows that Black residents are significantly more likely to live on or near dangerous roads with fast vehicle traffic and little lighting, as well as in in communities with less investment in transit, protected bike lanes, and well-maintained sidewalks.
Taken together with his study, Raifman says these data points signal a clear need for cities to more closely analyze the disparate aspects of traffic violence, not just for the nation as a whole, but in the specific places where Black and Hispanic residents are most likely to travel — especially when it comes time to make life-saving infrastructure investments.
"We don’t have this kind of data for even a city, let alone a neighborhood or a corridor," he said. "What’s problematic about that is that the way we prioritize infrastructure investment in America is often from the bottom up; we look at a specific street and say, 'There’s high risk of crashes here, let's make some changes.' ... But if it we see 10 fatalities at one intersection and two fatalities at another, but the first has a throughput of 1,000 people an hour and the other has a hundred, well — which street is really more dangerous? And what if the second intersection is located in a community of color?"
Raifman acknowledges that even his detailed analysis can't provide a perfect picture of who's dying most per-mile on America's roads — and that's mostly because of our national lack of walking and biking data.
In contrast to their (often federally mandated) obsession with measuring car throughputs and level of service for drivers, American transportation officials generally do little to understand how many vulnerable road users are even using their street networks, never mind how many people from different demographics are dying when they do. The most comprehensive travel survey in the country, the U.S. census, notoriously only collects data on which mode Americans use to get to work, rather than any of their other reasons a person might leave their home — and it doesn't include data on how far they travel, just how long the trip takes.
The National Household Travel Survey offers a more comprehensive glimpse of how Americans get around, but it isn't perfect either. Despite a significant recent revamp to incorporate anonymized cell-phone records about travelers' actual behavior, rather than their best self-reported guess, the federal database still won't capture Americans' year-round travel data, nor will it include people without smartphones.
Moreover, Raifman says it certainly can't stand in for the more granular, block-level analysis that policymakers need to make the most effective decisions — particularly as U.S. DOT doles out unprecedented amounts of money for vulnerable road user safety.
"There are billions of dollars in the Infrastructure Investment and Jobs Act for pedestrians and cyclists," he adds. "It would be really nice to see a focus on targeting communities that are lower income, as well as the racially and ethnically diverse communities [that die the most often per mile]."
Raifman acknowledges that more research needs to be done to understand the root causes of America's traffic violence disparities — but that shouldn't be an excuse for policymakers not to act.
"The jury’s out on what the causes [of these disparities] are, but I don’t think that should stop us from acting," he added. "I think it’s easy to say we don’t know why it’s happening and do nothing. But we need to do something. "


