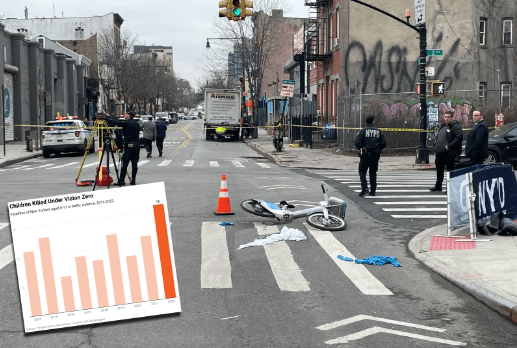
More children died in crashes last year than in another other year in the Vision Zero era and crashes remain concentrated in areas that are known to be treacherous, according to a new report that crunches the numbers on the bloody 12 months of 2022.
According to the detailed analysis by Transportation Alternatives, 16 children under age 18 were killed in crashes last year, up from 11 the year before. Three of the children were killed biking or walking to or from school, where roadways are far more dangerous, as Streetsblog reported last year.
( function() {
var func = function() {
var iframe = document.getElementById('wpcom-iframe-2af677bb86bb1a593e927af9d37b0a9f')
if ( iframe ) {
iframe.onload = function() {
iframe.contentWindow.postMessage( {
'msg_type': 'poll_size',
'frame_id': 'wpcom-iframe-2af677bb86bb1a593e927af9d37b0a9f'
}, "https://embeds.streetsblog.org" );
}
}
// Autosize iframe
var funcSizeResponse = function( e ) {
var origin = document.createElement( 'a' );
origin.href = e.origin;
// Verify message origin
if ( 'embeds.streetsblog.org' !== origin.host )
return;
// Verify message is in a format we expect
if ( 'object' !== typeof e.data || undefined === e.data.msg_type )
return;
switch ( e.data.msg_type ) {
case 'poll_size:response':
var iframe = document.getElementById( e.data._request.frame_id );
if ( iframe && '' === iframe.width )
iframe.width = '100%';
if ( iframe && '' === iframe.height )
iframe.height = parseInt( e.data.height );
return;
default:
return;
}
}
if ( 'function' === typeof window.addEventListener ) {
window.addEventListener( 'message', funcSizeResponse, false );
} else if ( 'function' === typeof window.attachEvent ) {
window.attachEvent( 'onmessage', funcSizeResponse );
}
}
if (document.readyState === 'complete') { func.apply(); /* compat for infinite scroll */ }
else if ( document.addEventListener ) { document.addEventListener( 'DOMContentLoaded', func, false ); }
else if ( document.attachEvent ) { document.attachEvent( 'onreadystatechange', func ); }
} )();
And road violence remains concentrated: According to TA, 44 percent of pedestrian fatalities occurred on what the city calls “Vision Zero Priority Corridors,” which comprise the most dangerous 7 percent of streets in the city.
The 255 total road fatalities was an improvement from the previous year, but remains the second highest since 2014.
“As we near the 10-year mark of Vision Zero, it’s clear we haven’t moved fast enough to address this crisis,” Danny Harris, executive director of Transportation Alternatives, said in a statement.
Harris said the Adams administration’s successes — such as Paseo Park on 34th Avenue in Jackson Heights and the new protected bike lane on Schermerhorn Street in Downtown Brooklyn — are evidence that “the solutions to traffic violence are in front of us.” But he also pointed out that the city failed to fully implement the legally mandated benchmarks in the Streets Plan of 30 miles of protected bike lanes and 20 miles of dedicated bus lanes.
“To end this crisis of traffic violence, Mayor Adams and [DOT] Commissioner [Ydanis] Rodriguez must scale these life-saving projects citywide by implementing the NYC Streets Plan … without delay.”
( function() {
var func = function() {
var iframe = document.getElementById('wpcom-iframe-b3ace1d63b2d2cce23948c0f7bf95f38')
if ( iframe ) {
iframe.onload = function() {
iframe.contentWindow.postMessage( {
'msg_type': 'poll_size',
'frame_id': 'wpcom-iframe-b3ace1d63b2d2cce23948c0f7bf95f38'
}, "https://embeds.streetsblog.org" );
}
}
// Autosize iframe
var funcSizeResponse = function( e ) {
var origin = document.createElement( 'a' );
origin.href = e.origin;
// Verify message origin
if ( 'embeds.streetsblog.org' !== origin.host )
return;
// Verify message is in a format we expect
if ( 'object' !== typeof e.data || undefined === e.data.msg_type )
return;
switch ( e.data.msg_type ) {
case 'poll_size:response':
var iframe = document.getElementById( e.data._request.frame_id );
if ( iframe && '' === iframe.width )
iframe.width = '100%';
if ( iframe && '' === iframe.height )
iframe.height = parseInt( e.data.height );
return;
default:
return;
}
}
if ( 'function' === typeof window.addEventListener ) {
window.addEventListener( 'message', funcSizeResponse, false );
} else if ( 'function' === typeof window.attachEvent ) {
window.attachEvent( 'onmessage', funcSizeResponse );
}
}
if (document.readyState === 'complete') { func.apply(); /* compat for infinite scroll */ }
else if ( document.addEventListener ) { document.addEventListener( 'DOMContentLoaded', func, false ); }
else if ( document.attachEvent ) { document.attachEvent( 'onreadystatechange', func ); }
} )();
Other key findings from the report included:
- A stunning finding that the NYPD is much more successful at solving hit-and-runs involving death or injuries in majority White neighborhoods vs. communities of color. The agency has rarely come close to equity in this area, but in 2020, it came as close at it ever has: roughly 33 percent of hit-and-runs in White neighborhoods were solved, vs. 31 percent in majority BIPOC neighborhoods. Last year, the gap widened: 36 percent of serious hit-and-runs were solved in White neighborhoods, but only 20 percent were solved in communities of color.
- The Bronx is still a danger zone, with 56 total deaths in 2022, tied for highest in the last 20 years, and about double the number of deaths in 2019. And bike riders are particularly susceptible: More cyclists were killed in the three years of 2020, 2021, and 2022 than in the 11 years prior before 2020, combined.
- The carnage is not equally distributed around the city. The safest neighborhoods in town, at least based on fatal crashes per 100,000 residents, are concentrated in the poorest neighborhoods. The highest fatality rate is in the Bronx/East Harlem Council District 8, where there were 10 fatalities last year for a fatality rate of 6.2 per 100,000. The Council district directly to the west, Council District 6 on the tony Upper West Side of Manhattan, had just two fatalities or a rate of 1.2 per 100,000.
The report counters the Adams administration spin on the year that was — with City Hall and the Department of Transportation touting top-line improvements in overall fatalities (255, down from 275 in 2021) and slight decreases in pedestrians and cyclists killed.
The agency said it would do more in 2023.
“In 2023, the DOT will continue working with city and state elected leaders on legislative proposals aimed at increasing accountability among reckless drivers and keeping drivers with a history of dangerous behavior off the roads,” the DOT said in an end-of-year statement.
The agency has also presented evidence that its speed-camera system, which started operating 24/7 on Aug. 1, is helping to reduce reckless driving. In August, the agency said, cameras recorded more than 755,000 speeding violations. That number dropped every month afterwards, with 661,000 violations in September, 586,000 in October, 565,000 in November and 522,953 in December — evidence, the agency says, that drivers are getting the message.


