BART and Caltrain See Similar Ridership Trends

A version of this post originally appeared on the Seamless Bay Area blog.
Recent customer surveys of BART and Caltrain riders show similar patterns in trip purposes and station access. Given the similarities, the customer research and ridership growth strategies are an opportunity for increasing functional integration and efficiency.
The recent surveys show that for both parts of the regional rail backbone, 61% of trips are work commute trips. About a quarter of trips using both services are for social, recreational, and other non-commute purposes.
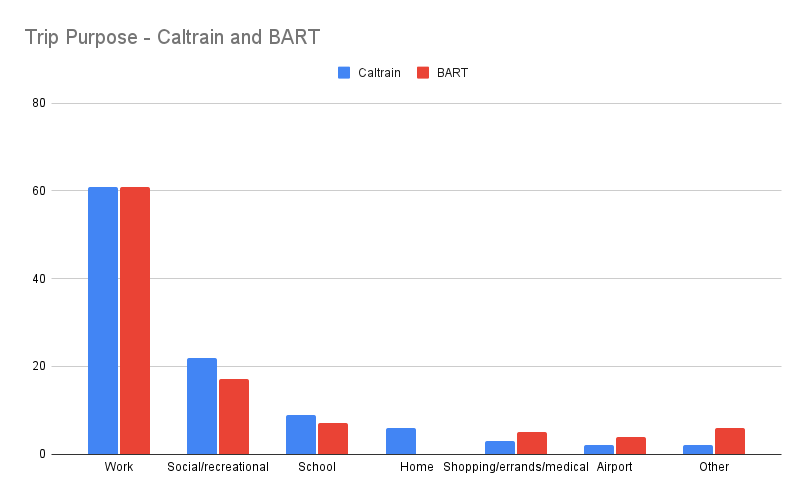
For both brands the share of work commuting has declined in the wake of the pandemic. The share of BART trips for work commuting declined from 70% in 2018 to 61% in 2022, while the share of Caltrain trips for work commuting declined from 77% in 2016 to 61% in 2022 (the agencies did earlier surveys in different years).
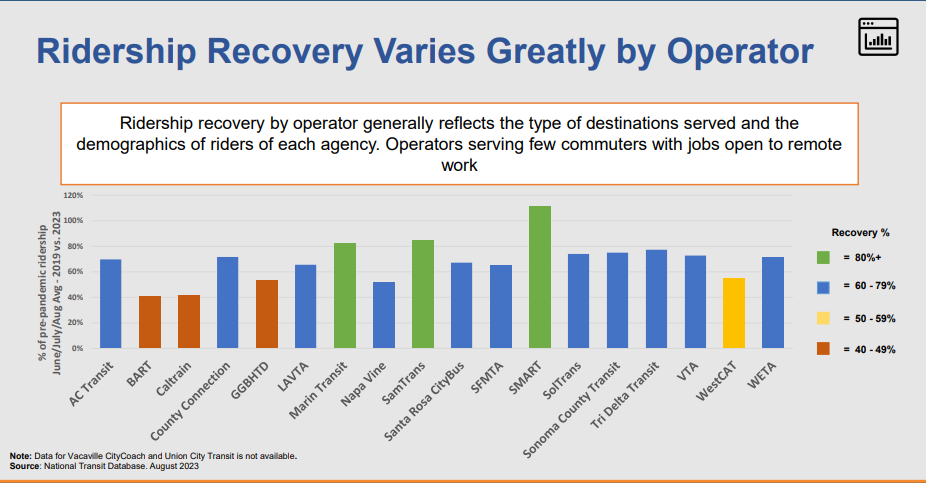
Ridership for both services has been recovering gradually since the steep pandemic decline, with faster ridership recovery outside of peak weekday commute periods.
For both brands, ridership recovery strategies include attracting commuters back with institutional passes (including BART for the first time, and with the first ever regional all-agency pass); and supporting a greater diversity of trips with a less peak-focused schedule.
Recent customer surveys of BART and Caltrain riders also show that for both parts of the region’s backbone rail service, walking, bicycling/scootering, and public transportation account for the largest share of station access – 59% for BART, and 71% for Caltrain. For both brands, the share of walking/biking/transit has increased in recent years – up from 50% since 2018 for BART, and up from 64% for Caltrain.
For the rail brands, about 17% of customers access the train via other transit services. It will be interesting to see how the regional pilot for free and reduced-price transfers will affect the share of transit access next fall. Also, the two segments of the core regional rail system are planning to jointly study standardizing fares, which was modeled in the region’s Fare Coordination and Integration Study to significantly increase ridership.
The biggest difference between the services is a higher share of bike/scooter access to Caltrain, and a higher share of driving to the station (24%) for BART. Because the surveys were done separately, there are slight methodological differences, and untapped opportunities for synergies by doing the surveys together using the same methods.
Given the consistent increase and difference in the share of bike/scooter access, we wonder if there are more granular patterns at different stations and in different cities’ investments in safe active transportation access. Caltrain publishes the distance that riders travel to and from the station, but BART does not.
Caltrain’s survey includes data about station egress (37% walking, 20% transit, 18% bike/scooter, 26% private vehicle), while BART’s survey does not publish this data.
With all of these similarities, there would seem to be efficiencies for the region to do combined surveys, and to work on ridership growth and access improvements with combined teams.
The post Parallel Ridership Trends – BART and Caltrain appeared first on Streetsblog San Francisco.
The post BART and Caltrain See Similar Ridership Trends appeared first on Streetsblog California.
Streetsblog has migrated to a new comment system. New commenters can register directly in the comments section of any article. Returning commenters: your previous comments and display name have been preserved, but you'll need to reclaim your account by clicking "Forgot your password?" on the sign-in form, entering your email, and following the verification link to set a new password — this is required because passwords could not be carried over during the migration. For questions, contact tips@streetsblog.org.