San Francisco Increasingly Dangerous for Pedestrians
Editor’s note: This is the first in a series of stories that will focus on how to improve streets for pedestrians.
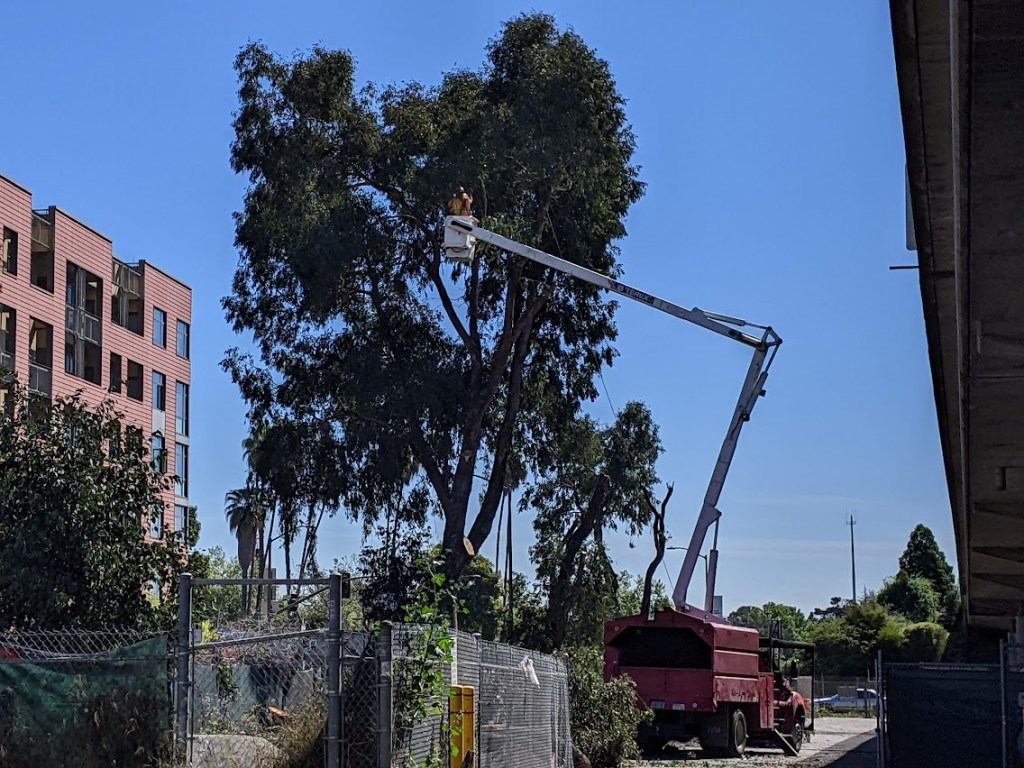
 Wide intersections like this one at Mission and 6th make it dangerous for pedestrians to cross.
We’re all being encouraged to exercise more and drive less. But sadly, more people walking in conjunction with the minuscule funding dedicated to pedestrian infrastructure will increase the number of pedestrians hit and injured or killed by motorists.
This has already been happening on San Francisco’s streets. According to a U.S. National Highway Traffic Safety Administration (NHTSA) study, SF is the 4th most dangerous city for pedestrians per capita (among U.S. cities with populations of 500,000 or more) and the streets are becoming more frightening by the day.
According to the latest crash data from the San Francisco 2007 Collision Report (PDF), in 2007 about 800 pedestrians were injured by cars. Given that as many as 21 percent of pedestrians don’t report the altercation, that amounts to nearly 3 pedestrians hit each day. Over the same period, the number of cyclists injured by cars increased by 31 percent to 451. Also, 32 pedestrians were killed by motor vehicles, an increase of more than 50 percent from the year before.
These crashes are not only devastating to the victims, but they burden health care systems and tax budgets. Twenty-five percent of pedestrian-auto fatalities were Muni crashes. In the past 7 years, Muni paid out about $66 million to people who experienced injury, wrongful death or property damage.
 Vehicle-Pedestrian Injury Collisions 2001 – 2005 CHP Statewide Traffic Integrated Record System
 Of all fatalities involving motor vehicles in SF, 26 percent were
pedestrian deaths, and of total injuries, 24
percent were pedestrians. In 2006, 9.6 percent of San
Franciscans walked to work. Despite the obvious quantified needs of
pedestrians, the percentage of San Francisco’s transportation budget
dedicated to pedestrian transportation is estimated to be less than one percent.
According to a study by UC Berkeley’s Traffic Safety Center,
over half (58 percent) of pedestrian crashes were drivers’ faults,
and the majority of these (35 percent) were drivers hitting pedestrians
in crosswalks, followed by excess driving speed. Fifty-eight percent of
driver-fault crashes were vehicles turning left. San Francisco has fewer
intersections with protected left turn phasing compared to most other
western U.S. cities.
As shown in the map above, the majority of pedestrian crashes occur in SOMA while a majority of all vehicle crashes happen on Market Street. Sixth Street at Market is the most dangerous intersection for pedestrians. It is no coincidence that the majority of collisions occur in areas with many one-way streets and multiple wide lanes, leading cars to drive very fast. As shown in the map below, most pedestrian crashes occur along the most expansive streets with fast moving traffic such as Market, Van Ness and Columbus.
 An Intensive Pedestrian Safety Engineering Study Using Computerized Crash Analysis
Crash Data 1996 – 2001; UC Berkeley Traffic Safety Center
NHTSA’s most recent analysis of pedestrian fatalities found that the pedestrians most often killed by cars are age 70 and over. This is especially dire given the fact that city populations are aging, and an increasing number of baby boomers are moving to urban areas for cultural attractions, lower property taxes, better public transportation, and highly accessible health care.
There are many simple engineering treatments to make streets safer, however, most engineers were trained to merely move traffic through cities. They will not change their ways unless they hear from you.

Streetsblog has migrated to a new comment system. New commenters can register directly in the comments section of any article. Returning commenters: your previous comments and display name have been preserved, but you'll need to reclaim your account by clicking "Forgot your password?" on the sign-in form, entering your email, and following the verification link to set a new password — this is required because passwords could not be carried over during the migration. For questions, contact tips@streetsblog.org.