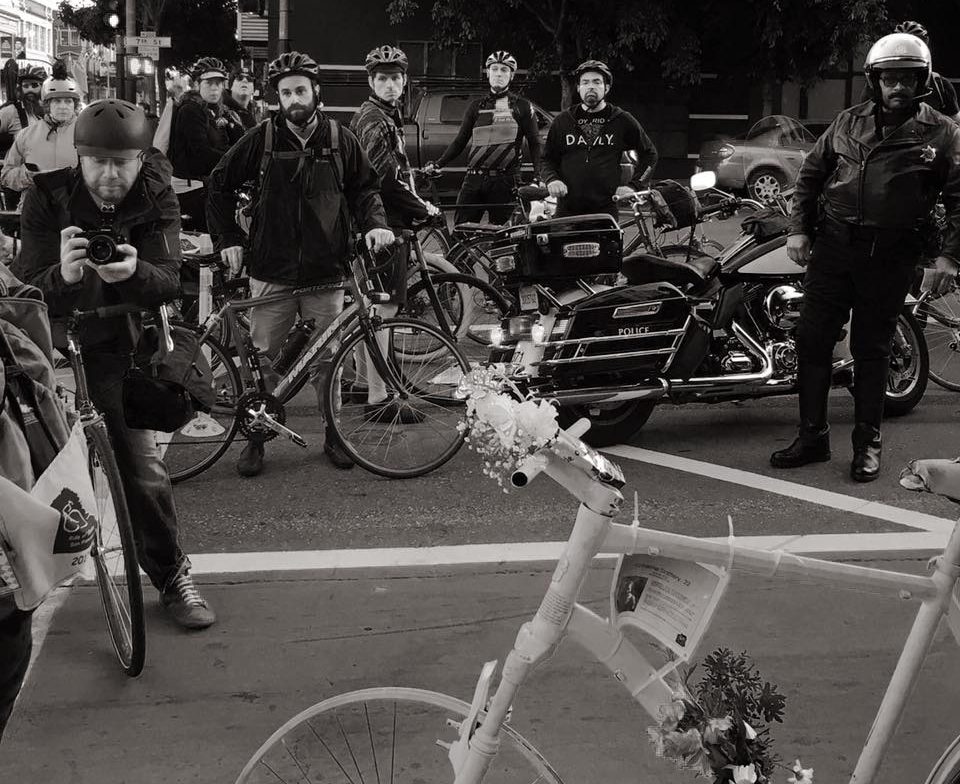
Streetsblog runs this story today as the city gets ready to ban private cars from Market Street. This can be a milestone, but only if the city follows through with enforcement and treats Wednesday's changeover on Market Street as the beginning of a city-wide transformation; 2020 can be the year San Francisco finally starts reversing the grim trends identified below.
In 2019, 42 people were killed in traffic violence in San Francisco--a 40 percent increase over the previous year. For comparison, there were 41 homicides in San Francisco in 2019. I’ve created a list of all the fatal collisions here, which includes the date, location, victim’s name, age, gender, circumstances, and links to news articles.
I created this list because the city does not publicly share one.
The victims of last year’s traffic violence include 22 people killed while walking, ten killed while driving, three killed while they were occupants in a car, three killed while riding motorcycles, one killed while riding a bicycle, and one killed while riding a skateboard. All of these victims were killed in collisions involving cars or trucks, with the exception of two of the motorcycles crashes, which were believed to be solo.
At least eight of those killed involved motorists who fled the scene.
The victims ages' range from Madlen Koteva who was 14 years old and Lucy Morales and Nancy Ng who were both 84 years old.
In 2014, the city of San Francisco set a Vision Zero goal to eliminate all deaths from traffic violence by 2024. You can view the legislation here. Since setting the goal, 192 people have been killed in traffic violence, and the death toll in 2019 is 35 percent higher than the death toll in 2014 when the goal was set. And these are just those killed; hundreds more were seriously injured.
Clearly, the city’s strategy for reducing traffic violence is not working.
The death toll of 42 in 2019 is 13 higher than the city’s own end of year Vision Zero count. This discrepancy is because the city excludes deaths which occur on state roads inside the city limits. I include these deaths because they occurred within the boundaries of the city and can be prevented. I used the same methodology in 2018 when the total death toll was 30 but the city's Vision Zero count for that year was 23.
Unlike San Francisco, other cities which have set Vision Zero goals have made progress reducing traffic fatalities. Take Oslo, a city of similar size to San Francisco. Through a strategy of removing cars and trucks from their city center, replacing on-street parking with bike lanes and wider sidewalks, implementing congestion pricing to reduce driving, reducing car and truck speeds, and improving public transit, they achieved Vision Zero in 2019.
***
Patrick Traughber is a resident of San Francisco and advocates for safer streets. He previously worked in the San Francisco Mayor’s Office during the Newsom administration. You can follow him on Twitter @ptraughber.


