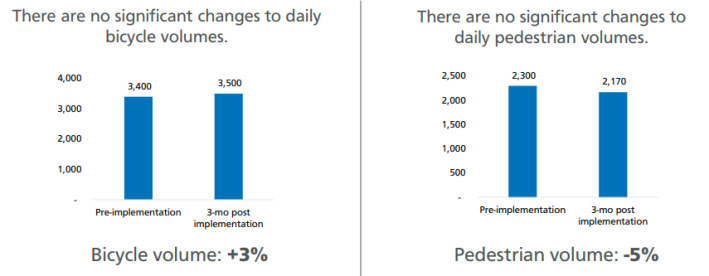
SFMTA released its long-awaited report on the status of the Valencia Street center-running bike lane on Thursday, more than six months after its official opening. The report states, “there were "no significant changes to daily bicycle volumes" compared to the same period last year.” The lane’s usage rebounded from a horrendous start a few months ago to meet its 2022 volumes.
During the period last year that they measured, before Valencia's center-running lane was installed, 3,500 cyclists were counted, "determined by taking the average 24-hour volume of several locations along the project area." Last year that number was 3,400, or a 3 percent increase. Pedestrian counts, meanwhile, decreased by 6 percent, from 2,300 to 2,170.
However, both figures are well within the margin of error -- meaning the installation of the center-running bike lane had no tangible impact on bike and pedestrian numbers on the corridor. This is, however, an increase over the roughly 50 percent drop in cycling rates on Valencia measured last fall.
SFMTA’s new numbers are similar to ones released by KidSafe collected through the Telraam sensor system.

But a more important measure of a bike lane project isn’t whether or not it has the same number of riders as the year before it was implemented, it’s whether or not the project creates a safer and more efficient commute. That data is hard to come by in this report.
According to the study, there were, on average, 2.4 people injured per month riding a bike or scooter or walking on Valencia on the stretch where the city installed its new center-running bike lane (see p8). The study also recorded 12 collisions involving bicycles from August through October (see p17) . "Six of them were due [to] illegal vehicle left/U-turns," wrote the SFMTA in a slide presentation that will be presented to the Board of Directors on Tuesday.
However, the report fails to address the most obvious question: did the number of injuries go up or down before and after the center-running lane opened? SFMTA is claiming the lanes are more safe in interviews, but do the statistics actually bear that out?
We’ve bluntly asked this of SFMTA and we’ll update this post when we hear back. We will also be writing a more detailed review of the forty-two page document when we return from the three-day weekend.
Until then, if you have any comments, concerns or thoughts about SFMTA’s report; leave them in the comments section.
Read and listen to more coverage of the report at Mission Local or KQED.


