Identifying Blocked Bike Lane Hot Spots
Between May 1, 2019 and January 31, 2020, 9,477 blocked-bike-lane reports were issued via Safe Lanes, a web site that lets cyclists log such violations. So what does that mean for policy makers when they decide where to focus limited resources to reconfigure curbs, provide new loading zones, and construct protected lanes that physically prevent motorists from driving and parking on bike lanes?
That’s what Marcel Moran, a PhD Student at the Department of City & Regional Planning at U.C. Berkeley is trying to answer with his new study “Eyes on the Bike Lane: Crowdsourced Traffic Violations and Bike Infrastructure in San Francisco, CA,” released earlier this month.
From Moran’s study:
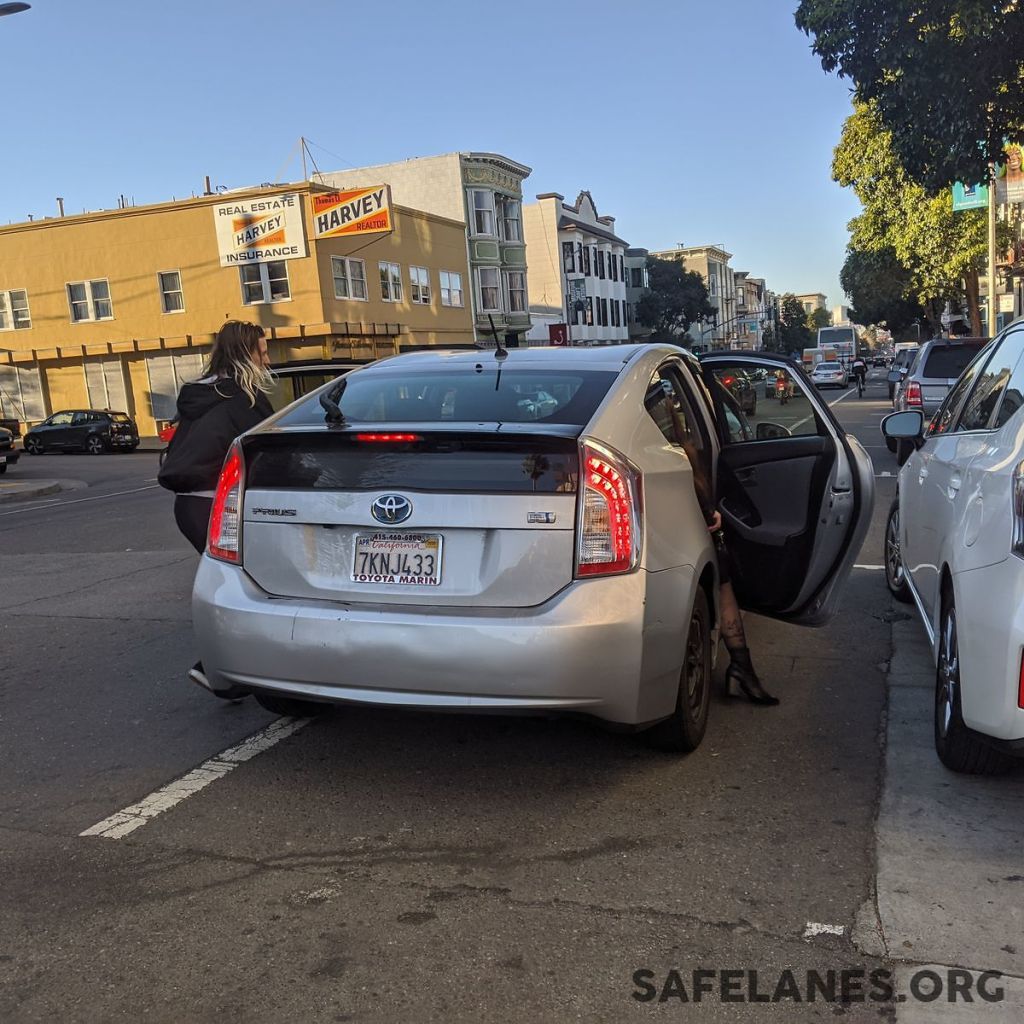
Among reports classified by vehicle category (5,769), private vehicles were the most-common, followed by delivery vehicles, ridehail/taxis, commercial trucks, and less than 10 percent comprised by public vehicles, private buses or shuttles, and physical obstructions.
As seen in the map below, reports were highest in “…the South of Market neighborhood (SoMa), the Mission District, and along the waterfront known as the Embarcadero, all areas which lie within the city’s dense northeast quadrant, have high rates of bike ridership, and contain a large share of San Francisco’s restaurants and offices.”
The report also compares the number of citations (available via the city’s own data portal) with the number of reports from the crowd sourcing, suggesting where more enforcement is necessary.
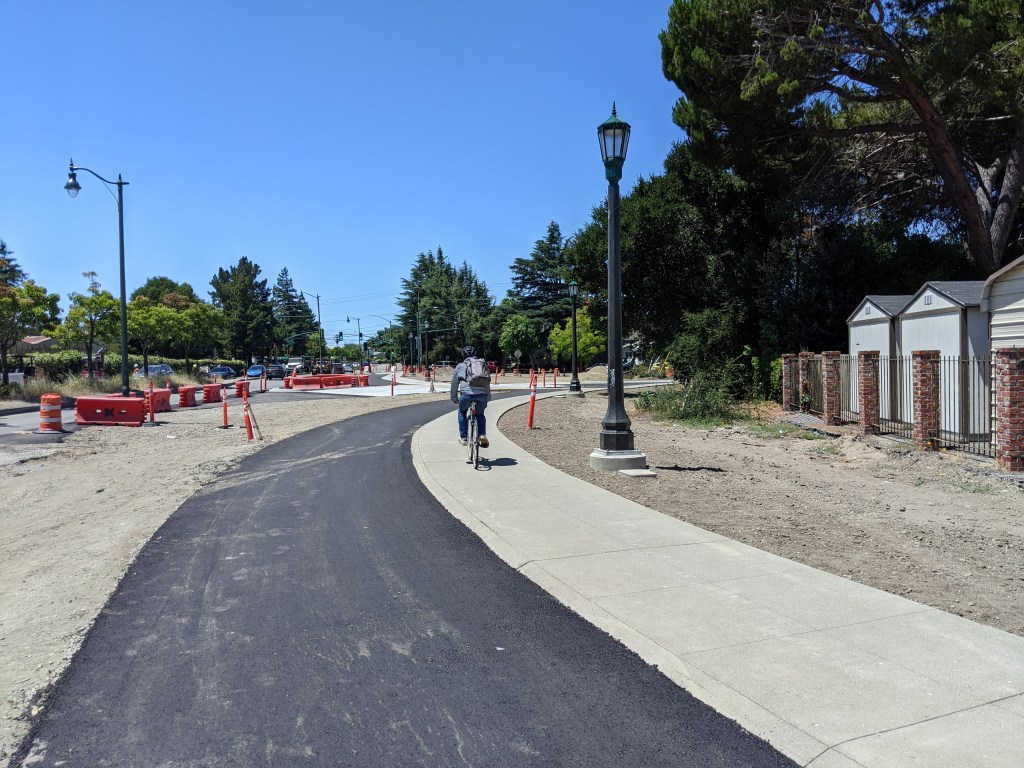
Overall, the report reinforces the notion that traditional striped bike lanes don’t work in practice. Physical protection is the only thing that will keep cycling safe and inviting for people of all ages and abilities. Otherwise, the ‘bike lane’ just becomes a de-facto loading zone. Even during the COVID lockdown, motorists continue to block the lanes (the Safe Lanes site has 25 bike lane violation reports logged in San Francisco in just the last 24 hours). Having this data compiled and analysed should go a long way towards directing resources to building protected bike lanes–and intersections–where they are needed most.
“Such locations should be prioritized for the installation of separated bike lanes, or at least widened lanes, given that narrower lanes have been associated with higher traffic conflicts,” concludes Moran in his study.
Be sure to check out the full report here.

Streetsblog has migrated to a new comment system. New commenters can register directly in the comments section of any article. Returning commenters: your previous comments and display name have been preserved, but you'll need to reclaim your account by clicking "Forgot your password?" on the sign-in form, entering your email, and following the verification link to set a new password — this is required because passwords could not be carried over during the migration. For questions, contact tips@streetsblog.org.