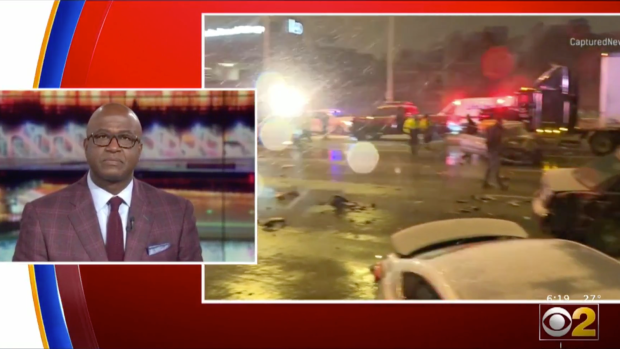
I noticed two things after Governor J.B. Pritzker issued Illinois’ Stay at Home order: In general my street got a lot quieter, but sometimes it got louder. I could hear drivers revving their cars’ engines from a block away and zooming past my house. I appreciated the lighter traffic, because most people stopped making non-essential trips by car, but I abhorred the new noises. There was even a crash: A driver used the buffered bike lane on Kedzie Avenue to pass another driver and then crashed into one of the support columns for the Bloomingdale Trail.
But I wanted to know how prevalent speeding has been during the pandemic. Thankfully, the city of Chicago releases a limited amount of data on its automated speed enforcement cameras. The Stay at Home order took effect on Saturday, March 21, at 5 p.m. The city’s database, however, only had statistics through Saturday, March 7, as the data is always delayed by two weeks to accommodate a double manual review of the images before a citation is issued.
It’s been more than a month since the order started, and there’s now a good period of data to analyze. I downloaded the speed camera ticket data from March 21, 2019, through April 21, 2020.
I calculated the average number of tickets issued per day per camera in Chicago, because the number of active cameras changes daily. This is because Illinois law only allows cameras installed near schools to issue tickets when school is in session, so those cams are turned off on weekends and holidays, and they’ve been deactivated since Tuesday, March 17, when the Chicago Public Schools closed.
The chart tells an interesting story. In the three weeks since the stay home order started, March 21 to April 13, Chicago has seen a higher number of speed camera tickets issued than any other three-week period since March 21, 2019. The averages vary a bit day to day because of the relatively limited number of tickets issued per camera, so I added a 7-day rolling average line to the chart to identify a trend.
The last time that the 7-day rolling average was sustained above 30 speeding tickets issued per camera per day was in December 2018. This analysis is incomplete, however, because there is not enough data to estimate what percentage of drivers are speeding. I can see that driving rates are down, but by how much? And there appears to be some seasonality to the rate at which speeding camera are issuing tickets. The city should provide the number of cars that pass each camera that are not issued a ticket.
On Friday the Chicago Department of Transportation tweeted that speeding has recently been up by 14 percent compared to the same time last year.
Another notable data point: Average speeds on highways have been measured to be much, much higher than the speed limits.
This is the dataset I created on the City of Chicago data portal.
Here are some tips on preventing the spread of COVID-19, and advice for Chicagoans on what to do if you think you may have been exposed to the virus.


