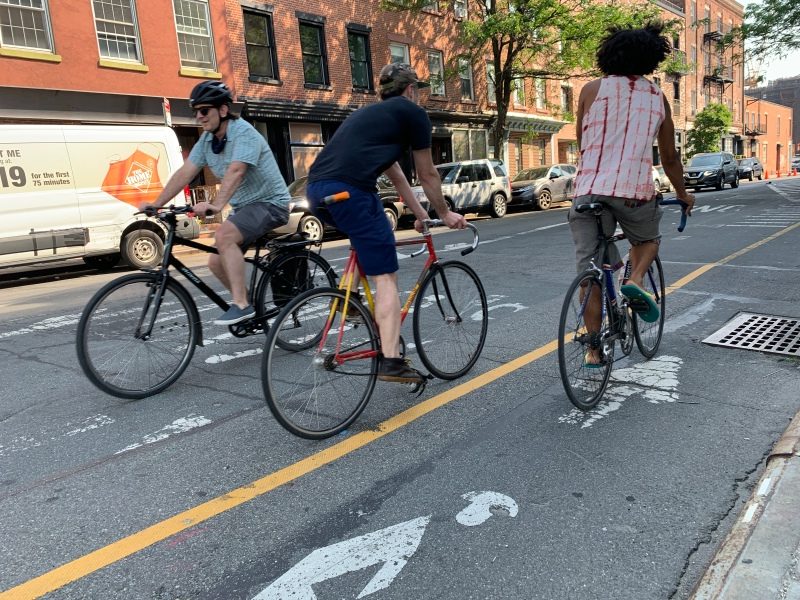
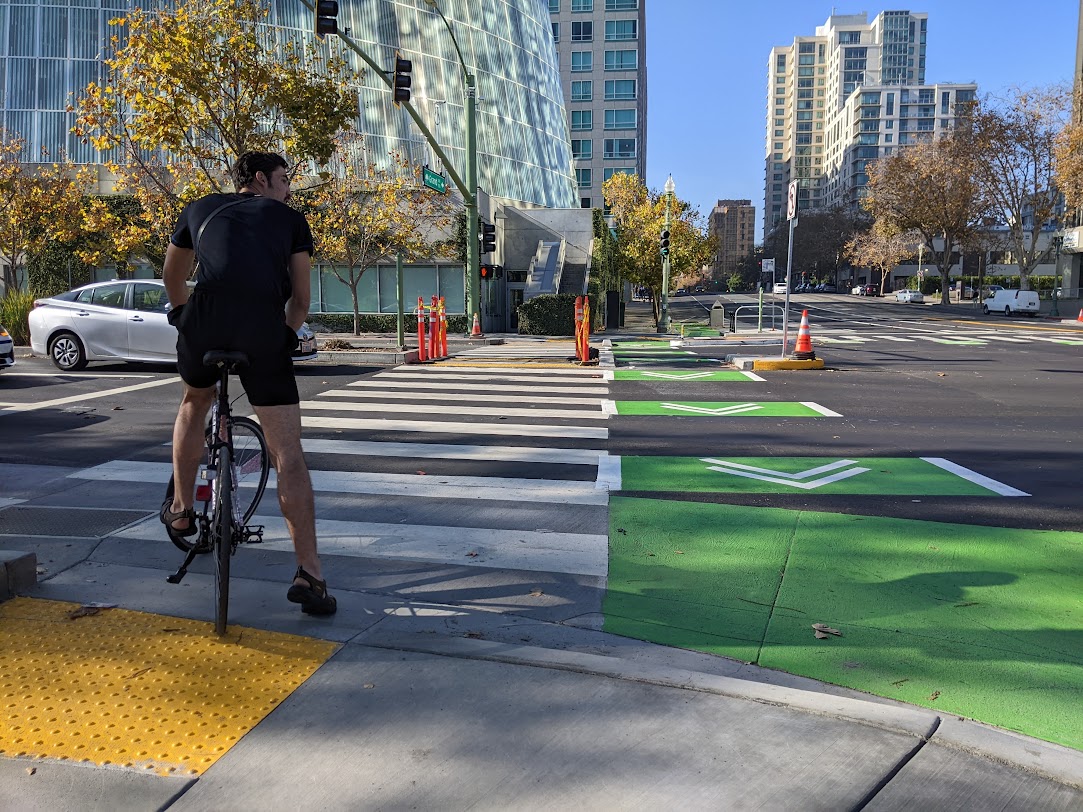
The number of cycling trips increased on every East River bridge and on other important cycling spans around the city in 2020 — the fruit of a bike boom that added roughly 100,000 daily cycling trips since Mayor de Blasio took office in 2014 and included a narrowing of the gender gap in bike riding in town, according to the final Cycling in the City report of the de Blasio administration.
Putting a cap on reporting on last year’s pandemic-driven shift to cycling, the new report shows that 3 percent more cyclists crossed the Queensboro, Manhattan, Brooklyn and Williamsburg bridges from May to December, 2020 compared to the same period in 2019. Daily trips over the East River Bridges also rebounded after a three-year slump from 2017 to 2019, bouncing from 20,624 trips per day in 2019 to 21,254 trips per day in 2020.
But in addition to the bridge boom, automated bike counters on the Kent Avenue greenway, the Pulaski Bridge and the Prospect Park West bike lanes all showed increases. A total of more than 200,000 additional cycling trips were counted on Prospect Park West, the Pulaski Bridge and Kent Avenue in 2020 compared to 2019 — evidence of plenty of trips being made far beyond the typical pre-pandemic commuting pattern.
Further backing up that data, bike use also steadily increased over the life of the de Blasio administration when it came to both commuting and non-work trips. Daily bike commute cycling trips, which are based on a three-year average of commuting patterns from the American Community Survey, jumped from 83,600 trips done by 41,600 cyclists in 2014 to 105,400 trips done by 52,700 cyclists in 2019, the last year such data is available. Researchers say that for every one commuting trip there are typically five additional trips in the city, which means that the total number of bike trips in the city grew from 420,000 in 2014 to 530,000 in 2019.
It sounds like a lot, but the DOT was unable to say how close the city has gotten to the mayor’s declared goal of having 10 percent of all trips in the city be made by bike by the year 2050, a goal he announced in the Green Wave plan during a particularly deadly period in 2019. (When he ran for mayor the first time in 2013, de Blasio hoped to get cycling to 6 percent of all trips in the city by 2020, up from just 1 percent at the time.)
The city’s cycling gender gap has also improved since de Blasio took office: The female share of bike commuters in the city went from 25 percent in 2014 to 28 percent in 2019 (which is a 12-percent jump). The report also says that 28 percent of Citi Bike subscriber trips were made by women in 2020.
The good news comes in the context of undeniably bad things happening on city streets in late stage de Blasio. As the mayor’s own handpicked panel of experts warned him about last year, the city is currently experiencing a massive increase in driving as the subway system — the primary form of transportation in town — is only carrying about 50 percent of its normal level. Even before many companies call their employees back to offices, car traffic in the city has already hit and surpassed pre-pandemic levels.
We live on a small crowded archipelago. This is not sustainable. Not for our lungs. Not for our life expectancy. Not for our planet.
— Jessie Singer (@JessieSingerNYC) October 6, 2021
We need to close every other major arterial street to car traffic and install car-free busways. We needed to do it yesterday. pic.twitter.com/km8sRRMVCa
All that car traffic has brought with it deadly consequences. As Transportation Alternatives points out in a new set of data analysis, the mayor is leaving office with Vision Zero going out on a gurney. This summer saw a record of carnage during the Vision Zero era, with 77 New Yorkers killed in traffic from June to August. The 24 Manhattan pedestrians killed over the summer of 2021 is more than the total number of pedestrians killed in the three prior summers combined.
Additionally, while cycling fatality numbers will not reach the grisly heights of 2019 and 2020 when 29 and 26 cyclists were killed on city streets, cyclist deaths this year have not been distributed in any kind of equal measure. The 10 delivery workers killed on bikes, e-bikes or scooters through September this year is outpacing the seven killed during all of 2020.
And of the 13 cyclists killed so far in 2021, almost half were in the Bronx, according to the TA data. The Bronx has been promised a series of safety upgrades to go along with a new e-scooter pilot and surge in bike riding, but none of the three protected bike lane projects on White Plains Road, Bronxdale Avenue or Eastchester Road has been completed.
The city will formally release the report on Thursday afternoon at a press conference with DOT Commissioner Hank Gutman.
